Issue #125, Volume #2


When Safe Bonds Get Thrown Out With Defaults
This is Porter’s Daily Journal, a free e-letter from Porter & Co. that provides unfiltered insights on markets, the economy, and life to help readers become better investors. It includes weekday editions and two weekend editions… and is free to all subscribers.
| Huge returns on safe bonds… Don’t panic when everyone else does… A delectable 224% total return… Global Financial Crisis echoes today… What the piano is playing now… Big Tech earnings time… Trucking deliveries are down… |
Editor’s note: Porter has turned today’s Journal over to Distressed Investing senior analyst Marty Fridson.
Marty has a long background in trading, investing, and finance… Over a 25-year span with Wall Street firms including Salomon Brothers, Morgan Stanley, and Merrill Lynch, he became known for his innovative work in credit analysis. He is the author of The Little Book Of Picking Top Stocks.
Below, Marty serves up an analysis showing that when the market begins to panic, lots of good assets get tossed overboard along with the bad ones. It creates a rich environment for juicy returns, he says.
Here’s Marty with the full story…
Would you consider a 37% annual return a pretty good investment outcome?
Also consider that this high performance wasn’t delivered by shares of a new technology company with wildly unpredictable earnings.
In fact, get this… that 37% was the average return in bonds of the industry with the lowest average annual default rate for the period 1970-2024, as reported by Moody’s Investors Service. What’s more, the bonds involved were the safest type of bonds, those that stand ahead of all other bonds in settlement of creditors’ claims in the event of a bankruptcy.
So they are safe.
Investors who bought the bonds at the optimal time were not rolling the dice and getting lucky. Far from it. The prudent buyers of senior secured utility bonds in November 2008 understood and took advantage of a market malfunction that caused many issues to plunge far below their intrinsic value.
Let me explain what happened – and how it’s relevant to today’s economic climate.
November 2008 was the month during the Global Financial Crisis when the largest number of bonds within the ICE BofA U.S. High Yield Index resided in distressed territory. (According to the widely accepted convention I introduced 35 years ago, “distressed” is defined by a yield 10 percentage points or more above the yield on a comparable U.S. Treasury bond.) In November 2008, there were 1,475 bonds in that category. That represented a staggering 84% of all the bonds in the high-yield index, a percentage dubbed the distress ratio. Prior to 2008, the distress ratio had never risen higher than 39%.
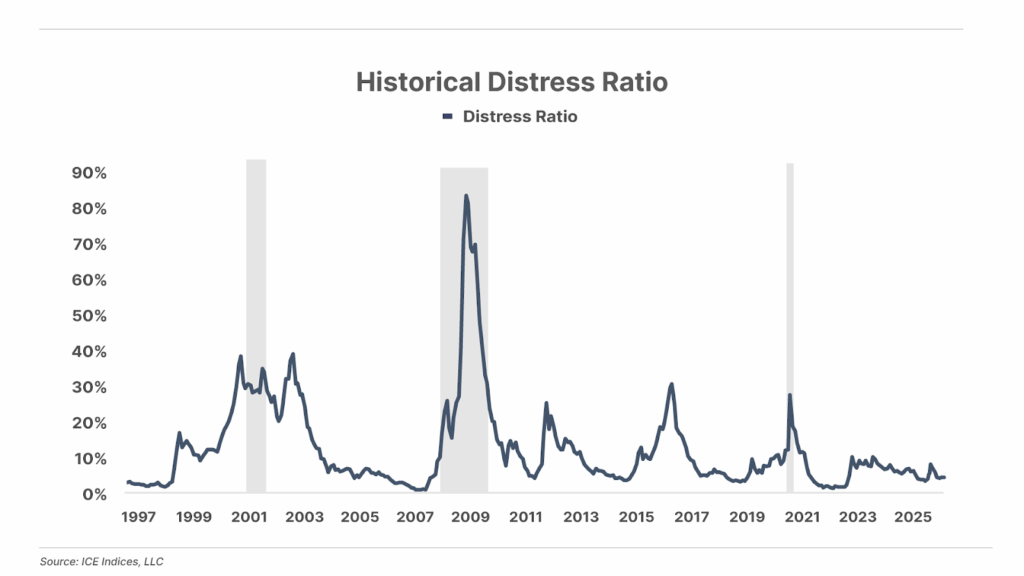
Certainly, default risk was sharply elevated during the horrific 2008-2009 recession. But that wasn’t sufficient to justify the vast majority of speculative-grade bonds being priced at levels implying very substantial risk of default within 12 months.
The other contributing factor was a breakdown in the normal balancing of supply and demand. Mutual fund investors were fleeing to safety in the face of the worst economic period since the Great Depression. Low-rated corporate debt was one category they were fleeing out of.
When mutual funds experience massive net redemptions, they have no choice but to sell securities in order to cash out the departing shareholders. But in the extreme conditions they faced in November 2008, the usual mechanism for liquidation broke down. Everyone was selling. Wall Street intermediaries couldn’t find buyers for the bonds because all of the other high-yield mutual funds were also in selling mode.
Ordinarily, if dealers can’t match a buyer with a seller, they may buy the bonds themselves and hold them in inventory until a mutual fund or other institutional investor wants them. But this was one of those times when you inevitably begin hearing the phrase, “Don’t try to catch a falling knife” – the dealers don’t want to take a bond into inventory because they fear its price is only headed down even more.
Desperate to raise cash, but finding no buyers for the bonds they most urgently wanted to unload, the high-yield mutual funds were forced to sell what they could sell. That included some bonds that didn’t pose much risk of defaulting.
This is where the opportunity to profit comes in. Astute, value-conscious buyers were happy to take them off the mutual funds’ hands at deep discounts to face value.
So it was that on November 30, 2008, distressed yields were available on senior secured bonds, the safest type, of nine utility companies, the lowest-risk industry in the high-yield universe by the measures cited above. One of the issuers and parts of two others were fully regulated companies, meaning government entities were required to ensure that they earned a fair return on their capital. The others engaged in non-regulated activities, such as independent power production. But all nine dealt in essential services – customers won’t turn off their electricity or gas just because things are tight.
Seven of the nine bonds included in this study were rated in the BB category, the top end of the speculative-grade range. None were in the bottom, most-default-prone class, CCC and below. Yet despite all these safety features, the nine bonds included in this study were priced, on average, nearly 20% below their face value.
Over the next 12 months the economy pulled out of a recession and all nine bonds posted hefty price gains, ranging from 16% to 35% and averaging 26%. Along the way, holders collected a double-digit average yield, bringing the senior-secured utility bonds’ average total return to 37%. Eight of the nine bonds finished the period with their credit ratings intact – one dipped from a high to a medium-B rating, but its price nevertheless leapt 32%.
The 37% average annual return achieved by these safest of speculative grade bonds was far from the highest recorded by distressed issues from November 2008 to November 2009. To cite just one of many astounding examples, the American Axle & Manufacturing 7.875% senior unsecured bond due March 1, 2017, more than tripled in price from $235 to $730. Taking into account the 33.51% beginning yield, the American Axle 7.875% bond delivered a delectable 224% total return.
You can expect to see similarly astronomical returns on selected high-yield bonds when, as Porter & Co. predicts, the current Everything Rally goes bust. Our monthly Distressed Investing report will aim to identify some of those ultra-high-return (but high-risk) opportunities.
The key takeaway from today’s Daily Journal, though, is that when sellers come to vastly outnumber buyers, outstanding opportunities will exist even in bonds – not limited to senior secured utility issues – that face no serious risk of failing to pay their interest and principal on time and in full.
As an old Wall Street adage goes, when the cops raid a bawdy house, they even arrest the piano player.

DARPA Set to Trigger New Boom: Buy These Three Stocks
Presented By Brownstown Research
By the end of this month, the government agency that invented the internet, DARPA…
Is set to make a critical quantum computing announcement…
That, Jeff believes, will send these three quantum stocks skyrocketing higher…
Including a $5 stock he calls “the NVIDIA of Quantum Computing.”
Three Things To Know Before We Go…
1. The Federal Reserve cuts rates again. This afternoon, the Federal Open Market Committee (“FOMC”) cut rates by 0.25% to a range of 3.75% to 4%, as expected – its second such cut this year. In addition, the FOMC also announced it would be ending its quantitative tightening (“QT”) program, which has been shrinking its balance sheet from around $9 trillion in 2022 to $6.6 trillion today. Beginning in December, the Fed will no longer allow its maturing Treasury bonds to “roll off” its balance sheet, but will instead reinvest the proceeds into short-term Treasury bills.
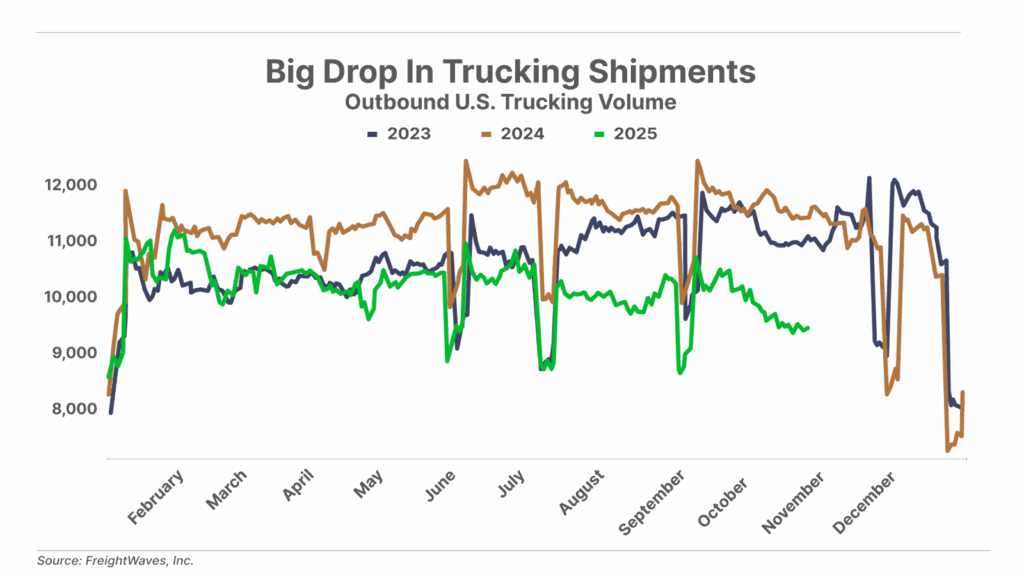
2. Trucking freight volumes are down – a warning sign for the broader economy. The SONAR Outbound Tender Volume Index (OTVI), a measure of U.S. truckload demand, is down 17% year over year. Because trucking primarily moves manufactured and finished goods, the drop reflects slowing output and softer end demand. Ongoing inventory destocking (following post-pandemic overstocking) and higher tariff-related costs have further reduced shipments, slowing freight flows. Beneath record-high financial markets and upbeat headlines around corporate earnings, the real economy appears to be losing momentum.
3. Big Tech earnings on deck. Hyperscalers Microsoft (MSFT), Alphabet (GOOG), and Meta (META) will report Q3 earnings after the market closes today. We’ll be watching the cash flow statements… As mentioned on Monday, the hyperscalers’ massive data-center investments to support the artificial-intelligence boom has transformed these companies into highly capital-intensive businesses. Meta, for example, has gone from converting over 100% of its earnings into free cash flow to less than 50% today. At some point, investors will demand to see a return on these data-center investments… or they’ll demand an end to this capex spending spree.

Today’s Poll – Can The AI Buildout Last?
And One More Thing… No Stopping Nvidia
Shares of the world’s largest company (by market cap) Nvidia (Nasdaq: NVDA) are up 45% since we recommended them in The Big Secret just over four months ago, in June… and up 50% for the year. Both impressive returns from a company that has averaged 75% annual returns over the last five years and that just notched the first-ever $5 trillion market cap.
Tell us what you think of today’s Daily Journal or anything else that is on your mind: [email protected]
Good investing,
Martin Fridson
New York, New York
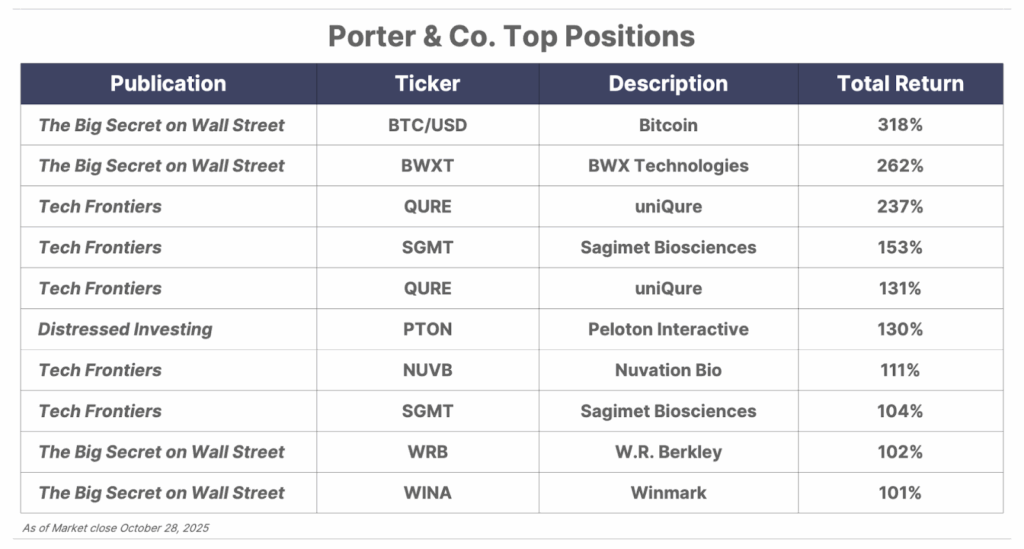
Please note: The investments in our “Porter & Co. Top Positions” should not be considered current recommendations. These positions are the best performers across our publications – and the securities listed may (or may not) be above the current buy-up-to price. To learn more, visit the current portfolio page of the relevant service, here. To gain access or to learn more about our current portfolios, call our Customer Care team at 888-610-8895 or internationally at +1 443-815-4447.