Editor’s Note: On Tuesdays we turn the spotlight outside of Porter & Co. to bring you exclusive access to the research, the thinking, and the investment ideas of the analysts who Porter follows.
As our readers struggle to navigate U.S. President Donald Trump’s trade wars, tariffs, and efforts to devalue the dollar, we’re seeing a lot of questions about what it all means for precious metals.
To answer that, we called on Marin Katusa to be our Spotlight guest because nobody knows how to navigate these waters or see what’s ahead. For the last 15 years Marin’s been involved in, and helped finance, countless resource investments around the world – several of which Porter has personally been involved in.
Gold mines, copper mines, silver mines, oil and gas fields, lithium, clean tech, uranium… you name it, Marin has been involved in it, and made himself and others very wealthy doing so.
He’s one of the greatest experts in the world when it comes to gold, silver, and natural resources.
In today’s Spotlight, he’ll explain what’s really going on in the gold markets, why he believes it is “going vertical,” what history tells us to expect next, how most investors are missing the story, and how you can capitalize on this move.
Enjoy.
P.S. If you want the name of the gold stock Marin Katusa is personally betting millions of dollars on because he believes it could move significantly higher in the next 12-24 months, click here for all the details.
Here’s What The “Media Blackout” On Gold Means For You
By Marin Katusa
When Bridgewater’s Ray Dalio increased his gold allocation in Q4 2023, he noted something crucial:
History shows that assets you might not want to own are typically the most undervalued.”
The current conflict between institutional positioning and public attention suggests we’re at a similar inflection point.
Consider Stanley Druckenmiller’s legendary 2003 gold trade…
He spotted the same pattern—institutional accumulation amid public indifference—and turned $200 million into $1.2 billion.
The Media’s Blindspot and “Brown’s Bottom” Moment
In 1999, Britain announced it was selling most of its gold reserves, when the price was $252 per ounce.
This became known as “Brown’s Bottom,” after then-Chancellor Gordon Brown, and marked the start of a 12-year bull market.
Today’s media silence on gold feels eerily similar to that moment.
Every major shift in wealth happens when the public is focused elsewhere. The signs suggest we’re watching one unfold right now.
While the media obsesses over AI and tech stocks, something unprecedented is happening in the gold market—and even veteran traders are missing it.
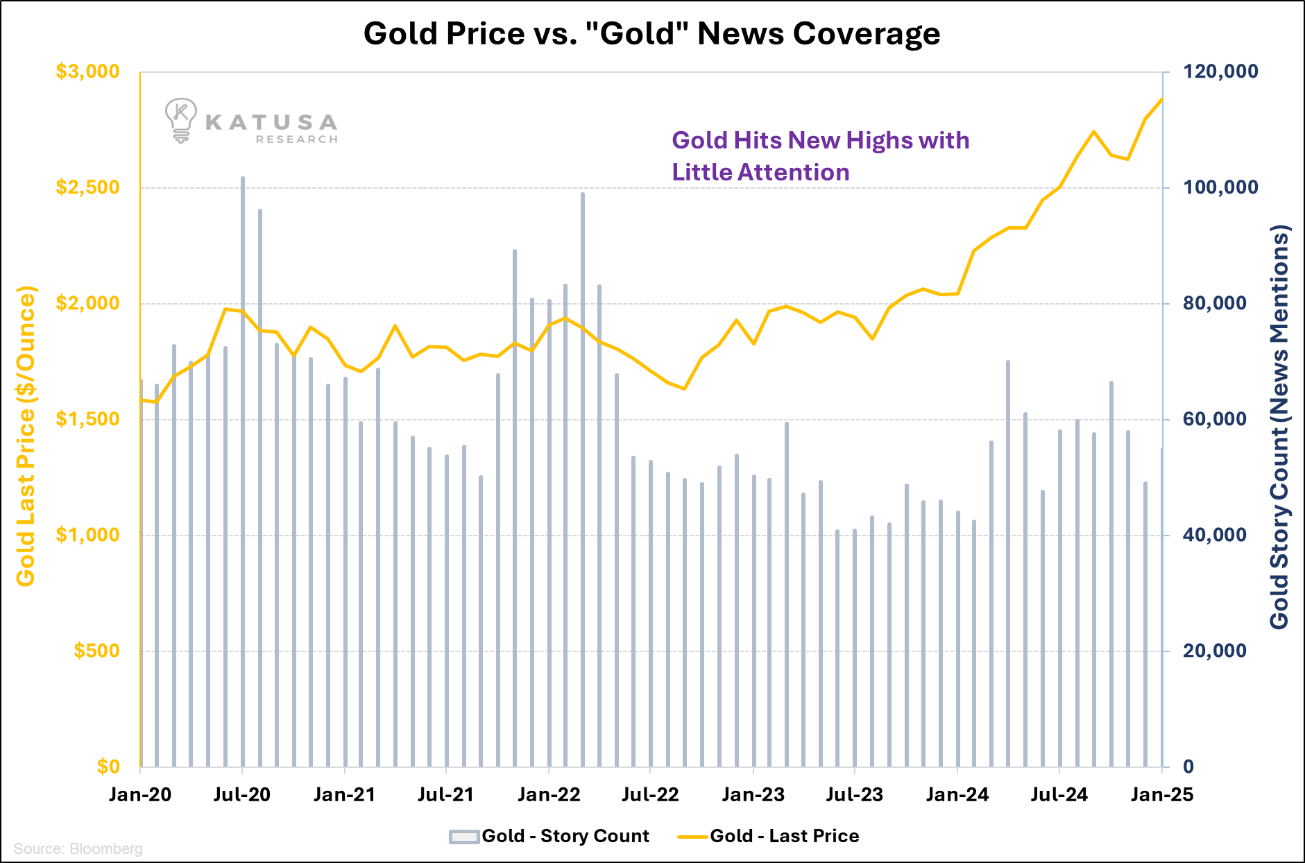
**Story count going into Feb 25th
There’s a puzzling disconnect in today’s market: Gold surged past $2,900 per ounce, yet Bloomberg’s gold news coverage index showed media attention at pre-Covid levels.
The last time we saw such a stark divergence was in March 2020, right before gold shot up 40% in six months.
- Things could be picking up in the coming months, especially with a potential audit of the gold held at Fort Knox.
Then things changed fast. At the end of the month, the story count made a sizeable spike up.
Gold: Is a Price Correction Around the Corner?
As we have witnessed gold’s unstoppable rally so far, I believe this is the best time to take a step back and ask ourselves: If this rally is purely driven by fundamental factors or there’s some market bias behind this rally.
First, let’s talk about the ‘Relative Strength Index’. RSI is a tool that shows if a stock or an asset, like gold, is being bought or sold too much in a given time period. It gives a score between 0 and 100.
- RSI being above 70 means the asset might be overbought (price could fall)
- RSI below 30 means the asset might be oversold (price could rise).
This can be further backed by tracking how much media attention was given to a stock or an asset. Historically, peaks in media mentions coincide with short-term market tops.
If RSI is overbought and too much attention is given to a stock or an asset, then there is good possibility that the prices could fall.
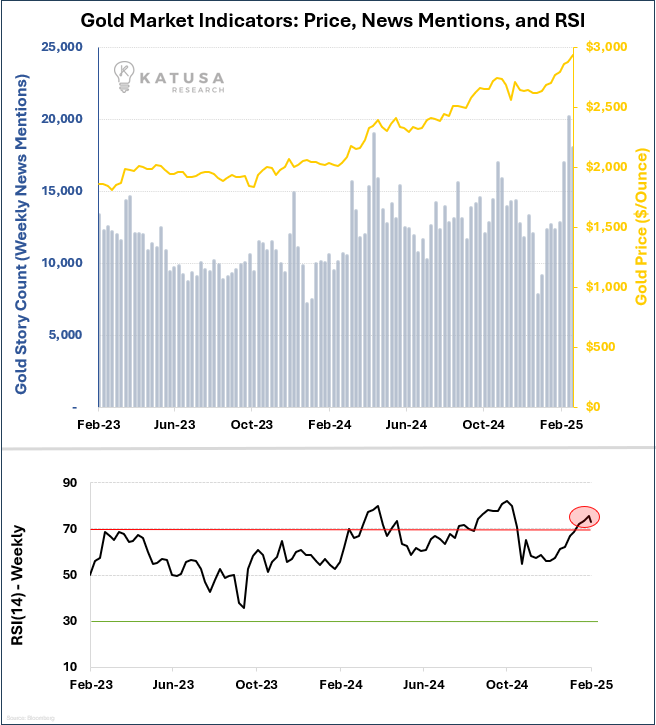
Now, let’s look the chart below for gold…
- Weekly relative strength index is above 70 and gold’s news mentions were on a record high of 20,000+ mention in February 2025 (especially towards the end of the month).
This suggests that gold is in overbought zone and might face near-term price correction, giving investors a second chance to load up on their favorite stocks.
And that’s not all…
The $241 Billion Secret: Wall Street’s Quiet Accumulation
Dig deeper, and you’ll find something even more remarkable.

Global gold ETFs now hold a record-breaking $241 billion in bullion, surpassing the previous peaks of $233 billion last month and $223 billion set in 2020.
For perspective, that’s more gold than the central banks of France and Italy combined.
- BlackRock’s data shows institutional investors have increased their gold allocations by an average of 12% in 2024 alone.
Morgan Stanley’s latest commodity report upgraded their gold price target to $3,000, citing “unprecedented institutional accumulation.”
Then right when the gold story count spiked higher, Goldman Sachs raised their 2025 year-end target to $3,100. And on the high side, a $3,300 year-end target. A lot of gold companies become cash flow monsters at those prices.
The Dollar’s Warning Sign
Here’s where patterns from the past become impossible to ignore.
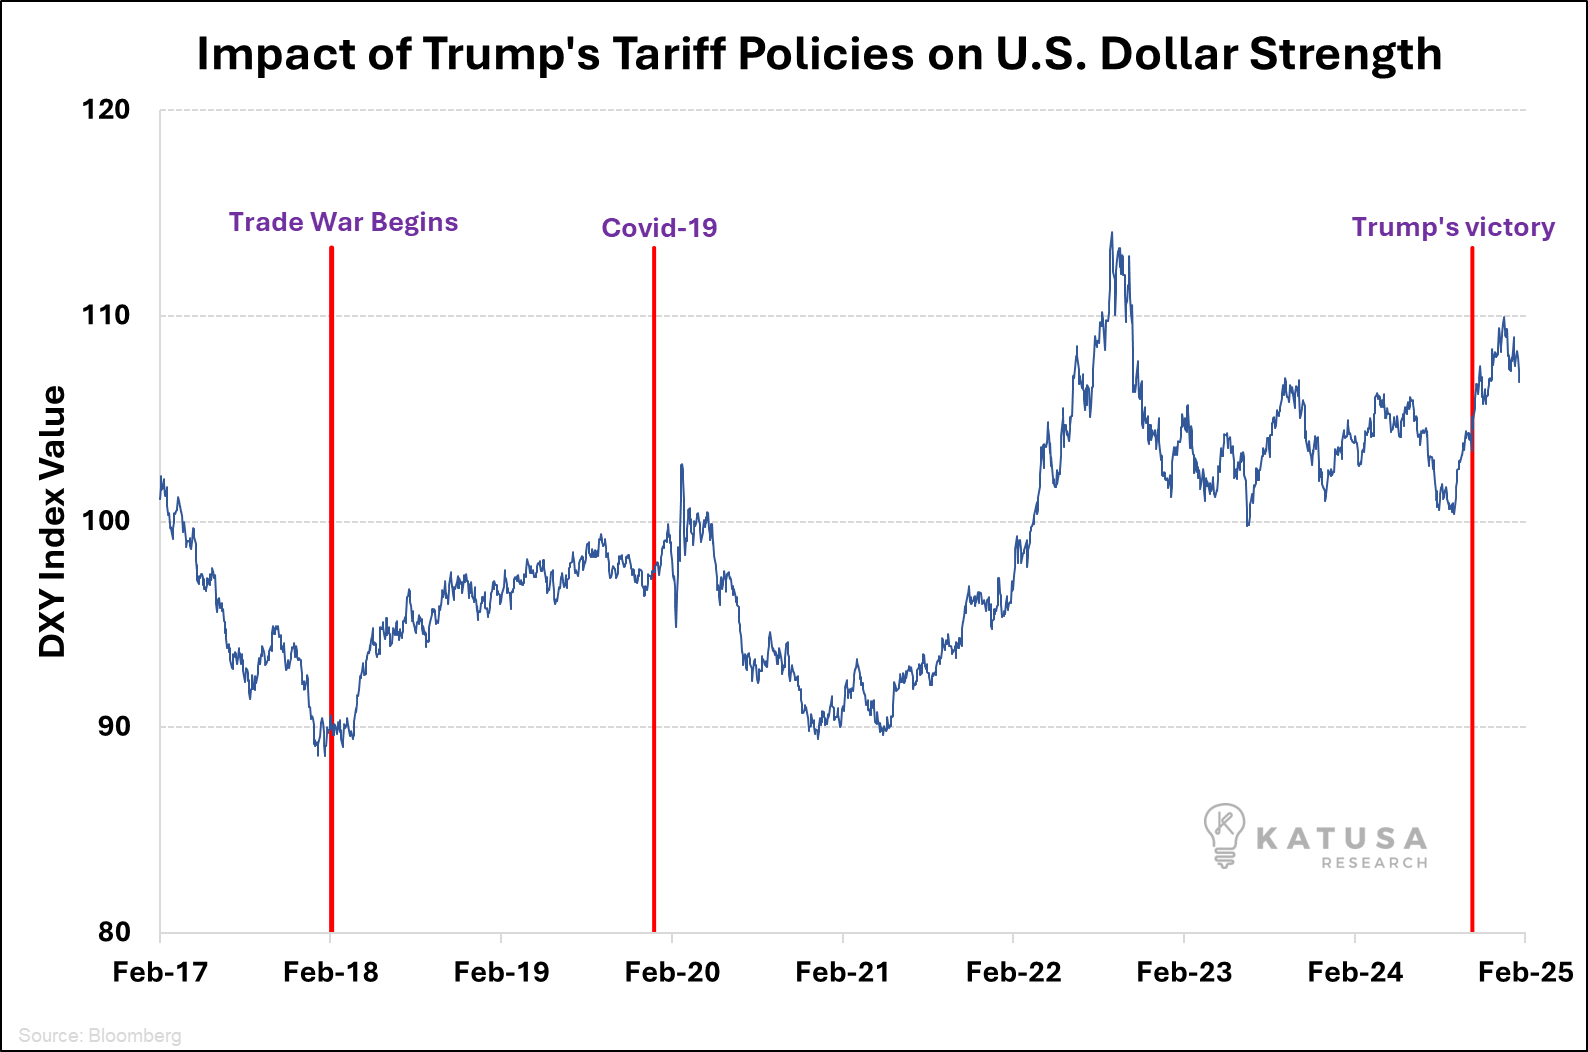
The Dollar Index (DXY) is flashing the same warning signals we saw during the 2018 trade tensions. Back then, the dollar weakened by 8% in six months. Today, with similar policy shifts looming, we’re seeing an almost identical technical setup.
The Gold Borrow is Unprecedented
As one analyst said, “Gold is trading like someone robbed Fort Knox”
Gold loans have hit record costs in early 2025, forcing traders to pay 10% to borrow shares of the popular gold ETF, up from just 1% in late 2024.
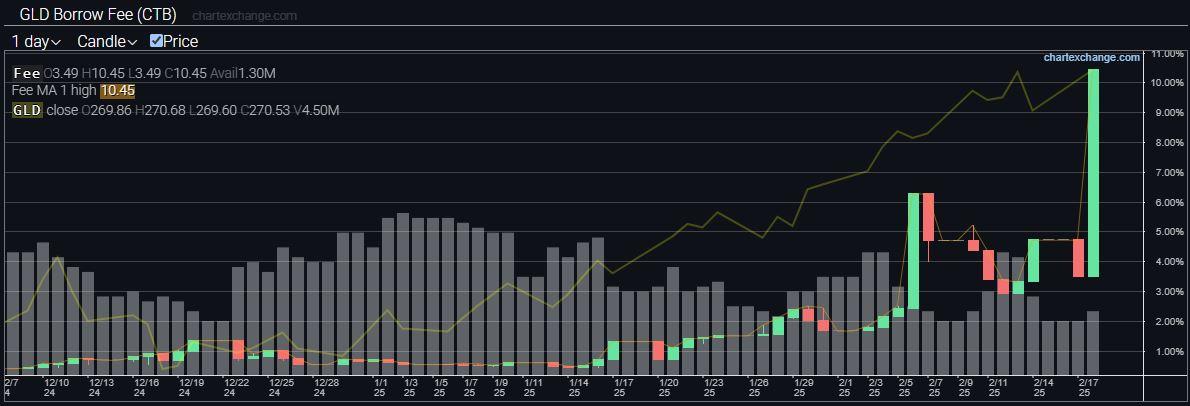
This substantial increase in the borrow fee rate could indicate:
- Growing demand to borrow GLD shares, possibly for short selling
- Reduced availability of GLD shares to borrow
This steep jump signals a major shift in the gold market.
Four Catalysts Aligning
- Media Blackout: Current news coverage is 40% below the 5-year average despite record prices
- Institutional Positioning: ETF holdings have grown by $40 billion in just 90 days
- Dollar Vulnerability: Technical patterns mirror the 2018 pre-rally setup
- The Gold Borrow Rates
And don’t forget the China factor. What many miss is China’s strategic gold accumulation.
- The People’s Bank of China has added gold reserves for 16 consecutive months, accumulating over 6.75 Million ounces of gold (225 tons of gold).
The last time they went on such a buying spree? 2009, right before gold doubled.
Why 2024 Is Different Than 2011
During the 2011 gold peak, CNBC ran an average of 12.4 gold-related segments per day. Today? Less than 2.
The World Gold Council’s latest report shows retail investment making up just 15% of total gold demand, the lowest level since 1973.
Today’s gold market shows the exact setup that preceded the last three major rallies:
- 2001-2002: Low media coverage, high institutional buying, 142% gain followed
- 2009-2010: Similar pattern, 185% rally ensued
- 2019-2020: Same signals, 43% surge in 6 months
The Opportunity Hidden in Plain Sight
The World Gold Council’s latest flow data shows institutional buying accelerating.
The last three times we saw similar institutional inflows combined with below-average media coverage (2002, 2010, 2019), gold averaged 75% gains in the following 24 months. Every major shift in wealth happens when the public is focused elsewhere.
So how do we make money? Getting positioned.
And one of my largest gold positions (and I’m looking to buy even more) is…
“Doctor Q’s” $4 Billion Legend’s Secret Gold Play in America’s Richest Soil
A legendary mining CEO who sold his last company for nearly $4 billion just revealed his next move – and he’s working for free.
Why? Because he owns 8.5 million shares of a company sitting on America’s next great gold producer.
This past producing, multi million ounce gold deposit on a private-land gold project, next door to a +$200M cash generating mine…
Just DOUBLED the amount of gold within one of its deposits.
With $300M in financing on standby ready to go when Doctor Q says go, and gold hovering around $2,900, Wall Street is about to notice what smart money already sees.
Click here to see why I’ve invested 7 figures of my own money in this company…
In what could be America’s next multi +100,000 oz/year producer.
Yours truly,
Marin Katusa
Founder, Katusa Research