Issue #37, Volume #1


When LBOs and Gordon Gekko Ruled
| This is Porter & Co.’s free daily e-letter. Paid-up members can access their subscriber materials, including our latest recommendations and our “3 Best Buys” for our different portfolios, by going here. |
Three Things You Need To Know Now:
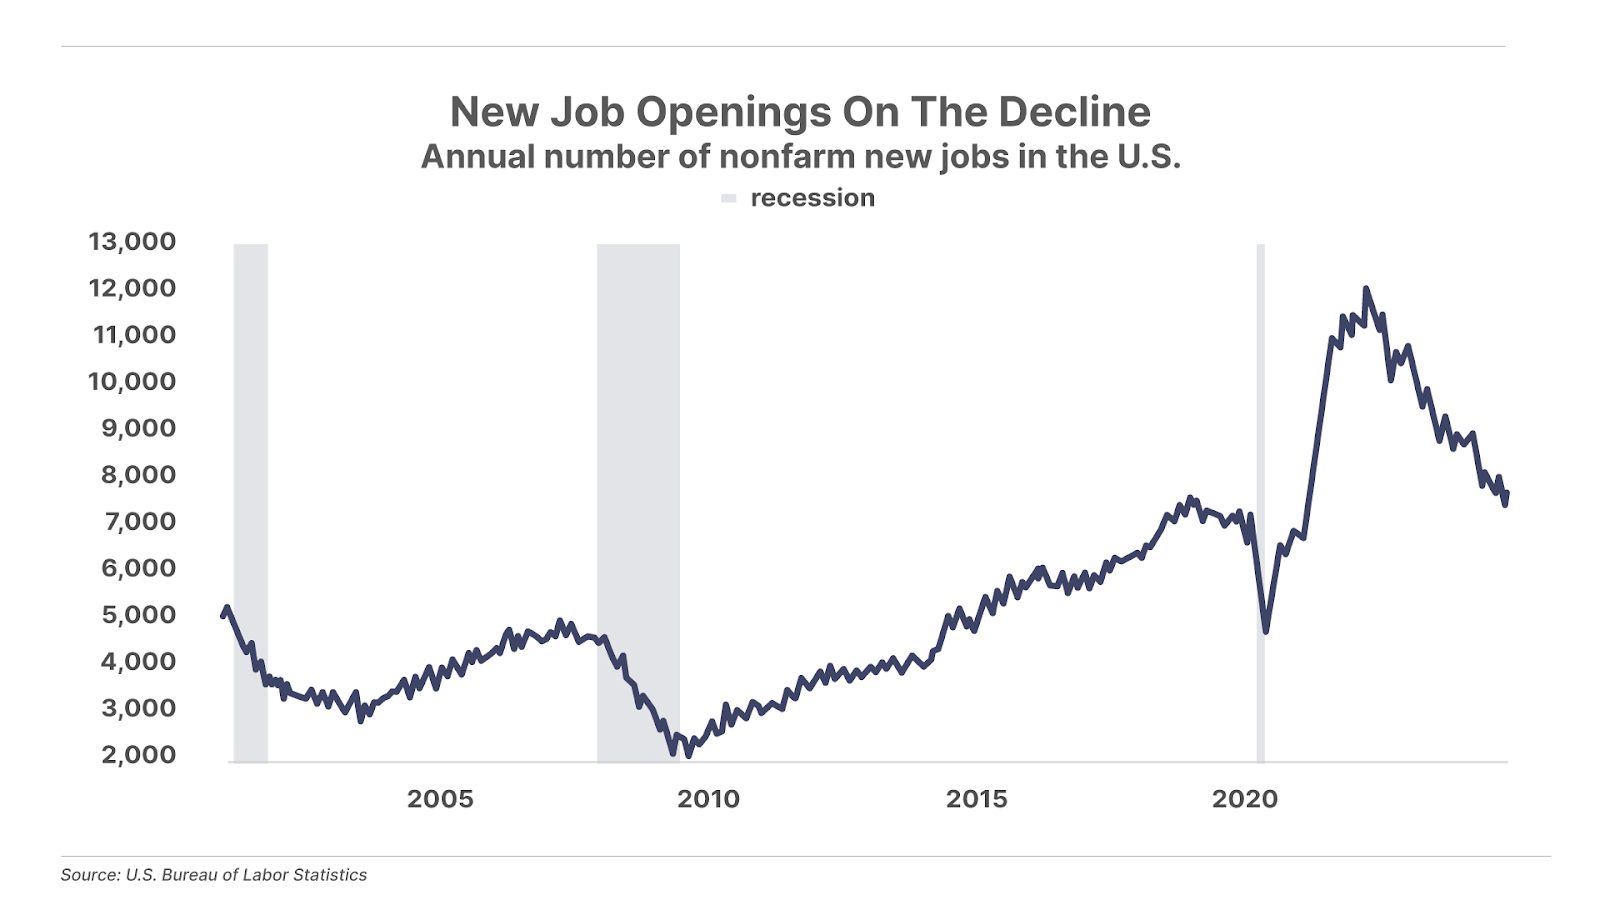
1. The labor market remains weak. The latest data from the U.S. Job Openings and Labor Turnover Survey (“JOLTS”) from the Bureau of Labor Statistics showed job openings increased by 372,000 to 7.74 million in October. Though solid, the increase doesn’t change the downward trend of the past two and half years. Similarly, the number of vacancies per unemployed worker – a metric the Federal Reserve follows closely – rose to 1.11, up from 1.08 in September, yet remains well below the pre-COVID trend of 1.2.

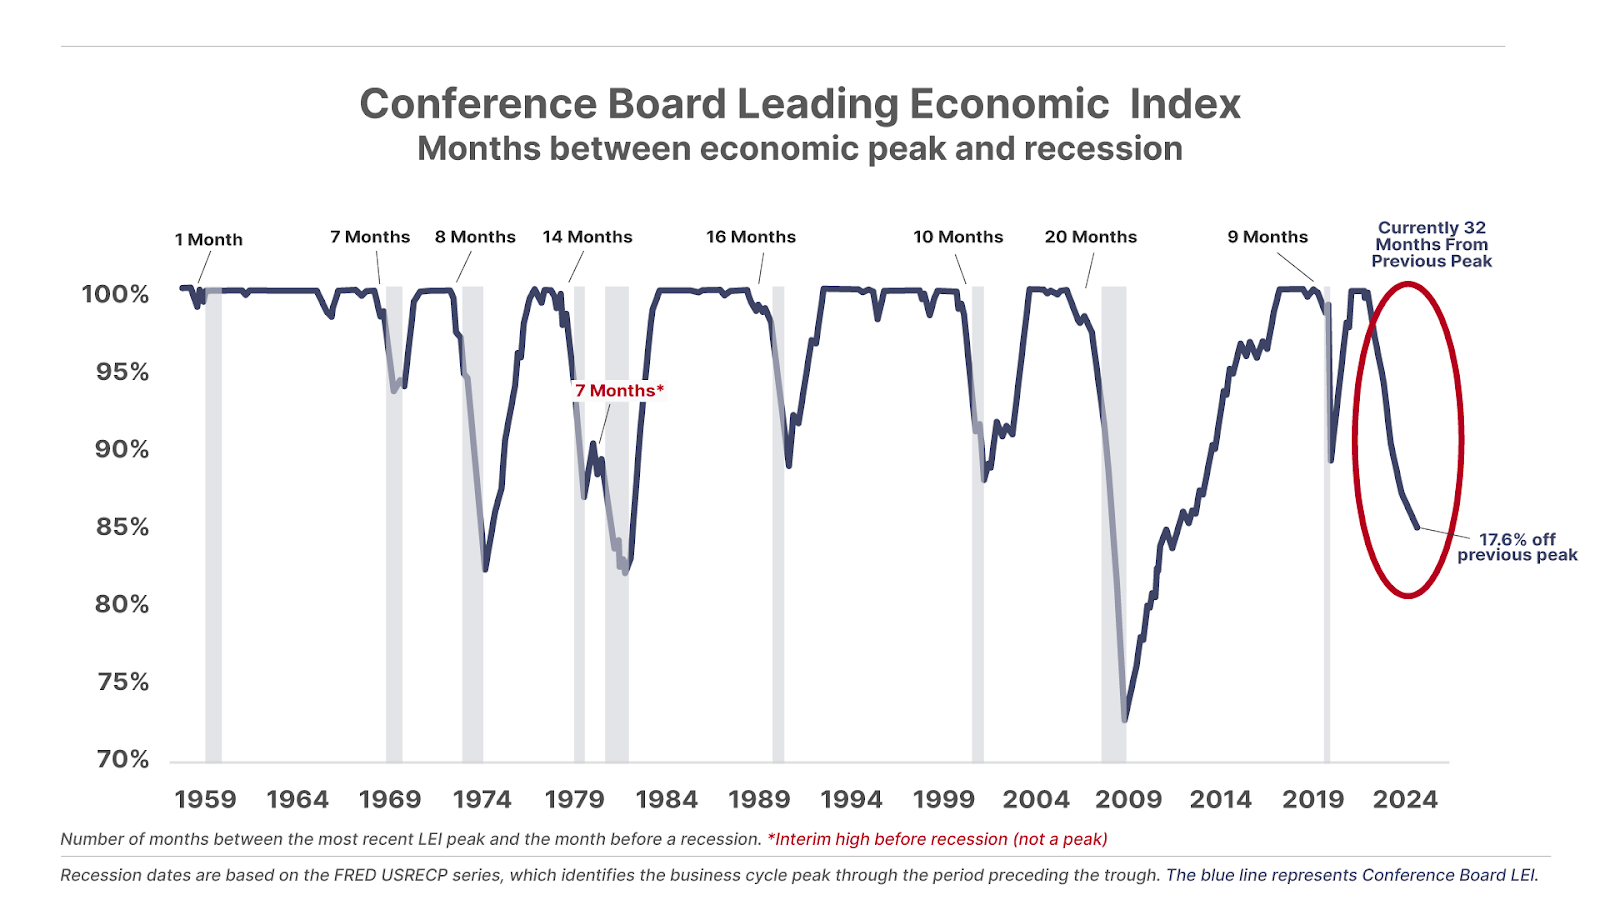
2. Leading economic indicators are screaming recession. The Conference Board’s Leading Economic Index (“LEI”) fell to its lowest level since March 2016, marking the eighth consecutive monthly decline. The LEI gathers various pieces of consumer and business data to provide an early read on where economic activity is headed. On average, a recession starts roughly 11 months after the peak in the LEI. Today the LEI is 17.6% below its latest peak, while the index has not increased in 32 consecutive months – the longest streak on record without a recession. Yet the Conference Board’s Consumer Confidence survey shows that consumer confidence is at all-time highs – while the Fed’s latest GDP estimates were revised upward to 3.2%. Leading economic indicators are weakening while markets and consumer confidence are peaking… something’s gotta give.

3. Still spending like a drunken sailor… The U.S. budget deficit soared to $258 billion in October, one of the biggest monthly deficits ever. Debt as a percentage of GDP has increased to 121%, the highest level in U.S. history (excepting the statistical blip of the COVID-19 shutdown). Debt to GDP has doubled since the 2008 Global Financial Crisis, as federal deficit spending has ballooned the debt by nearly $27 trillion over that time… Musk, Ramaswamy, and their Department of Government Efficiency have their work cut out for them.

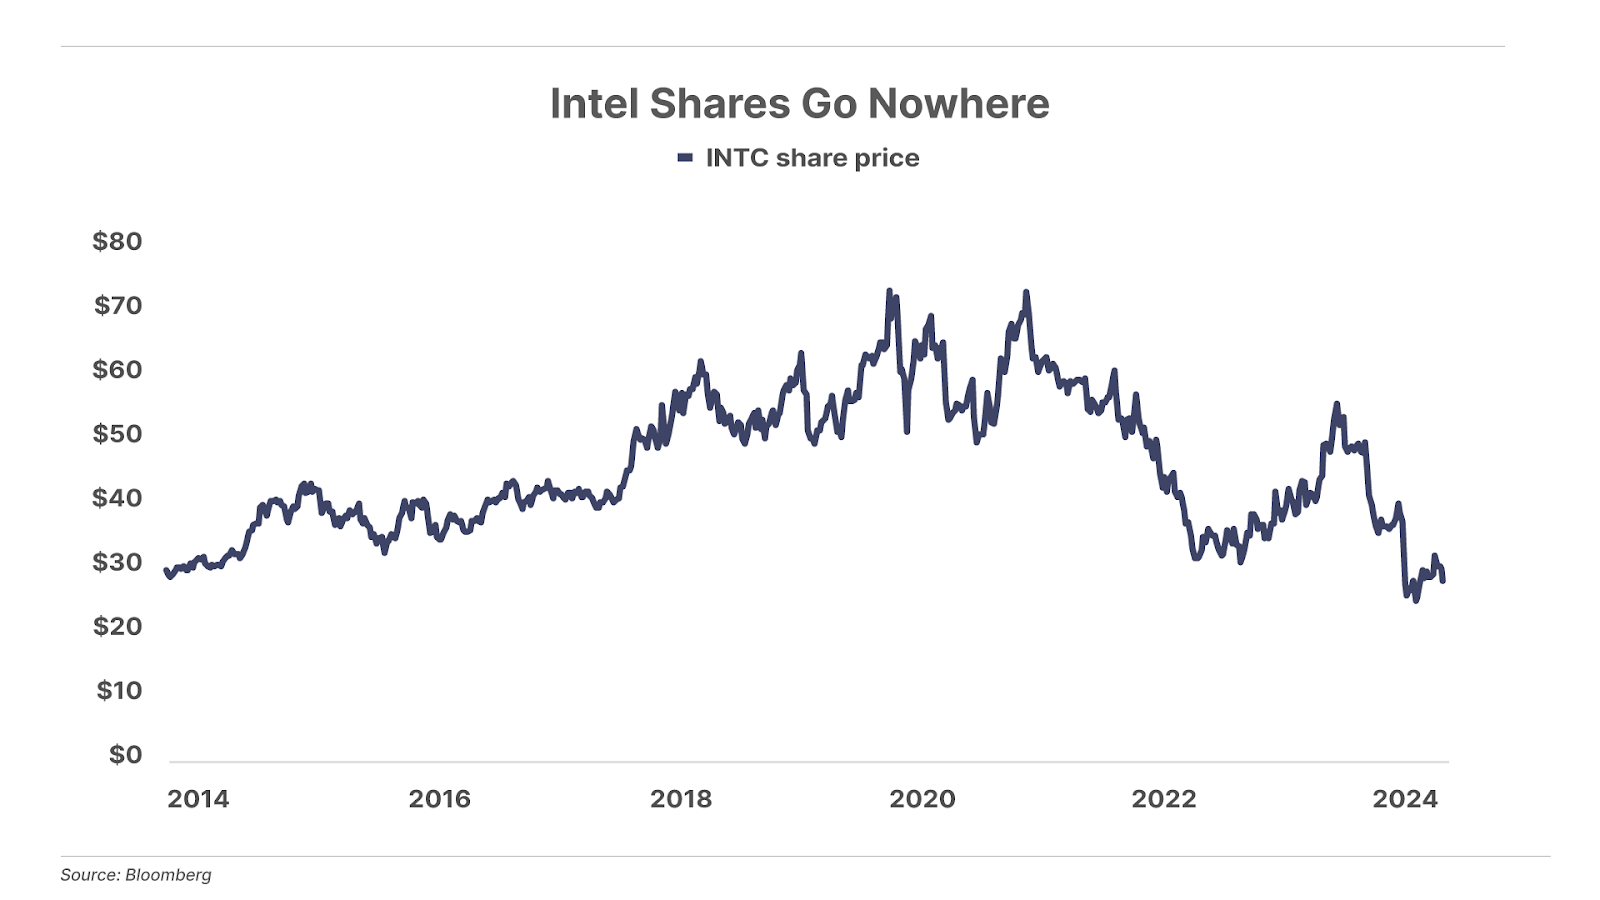
And one more thing… Intel’s CEO defenestration. Forty-year Intel (INTC) veteran and CEO Pat Gelsinger was forced into immediate retirement by the company’s board on December 1. Geslinger was the architect of Intel’s terrible decision to invest heavily into the low-margin foundry business (to manufacturing chips) – in contrast to (one-time) rivals Nvidia (NVDA) and AMD (AMD), which outsource chip production. Intel’s foundry business lost the company $7 billion last year – and likely twice as much this year. Intel shares are an S&P 500 cellar dweller – including a 58% loss year-to-date – and the company was booted from the Dow. One option, with Gelsinger gone, may be to spin off the company’s foundry unit. But Intel’s board doesn’t seem to have a Plan B… and whoever draws the short straw to be the company’s next CEO has his work cut out for him.

Puzzled by chips and what these companies all do… and how it all works? We’ve put together the best explanation of the parallel processing revolution – including the companies at the center of it all – that you’ll find anywhere. Go here to learn more.
The Wild West Of Bonds
When LBOs and Gordon Gekko Ruled
Marty Fridson, the lead analyst for Porter & Co.’s Distressed Investing, is revered in his field. Called “the most well-known figure in the high-yield world” by Investor’s Digest, Marty joined Porter & Co. in March 2023. Since then he’s made 15 distressed-bond recommendations and six for distressed stocks – of the 13 current open positions, including eight bonds (up 15.2%) and five stocks (up 69%), 11 are in the green, resulting in an average portfolio return of 29.7%.
Last month, Marty wrote about how companies looking to raise capital tend to issue new bonds at what is often the best possible time for the issuer… which happens to be the worst time for investors.
Today, Marty reflects on the eulogies that were written for the high-yield bond market after what he dubbed the Great Debacle… that were, as Mark Twain might say, “an exaggeration.” And the environment that led to the high-yield massacre back then isn’t so dissimilar to what we’re seeing today…
Here’s Marty…
In finance – as in life – just as things seem to be at their worst, the pendulum swings the other way… and what seemed to be an end-of-the-world disaster… turns out to not be such a big deal after all.
The high-yield bond market’s Great Debacle of 1989-1990 is a stunning case in point. And it’s also a critical lesson about being ready for what’s next – to be prepared for what is likely a major market blowout that’s coming at some point soon.
The setup for the Great Debacle (a term that I originated and which was adopted by financial-markets historian Robert Sobel) looked like: From early 1985 through late 1988, the 10-year U.S. Treasury yield dropped from from 12.46% to 8.85%, as the debt market continued to adapt to lower inflation following years of double-digit growth in inflation during the 1970s. That was an enormous move – and resulted in, among many other things, a boom in leveraged buyouts (“LBO”) and hostile takeovers. Cheaper capital meant that more companies had the money to go shopping for competitors.
Three events help define the era:
- the high-profile bidding war that eventually led to the $25 billion LBO of food and tobacco giant RJR Nabisco, led by private equity firm Kohlberg Kravis Roberts (and immortalized in the book Barbarians at the Gate)
- Canadian real estate developer Robert Campeau’s $6.3 billion hostile takeover of Federated Department Stores, which Fortune called “the biggest, looniest deal ever”
- The movie Wall Street, in which Michael Douglas played an unscrupulous trader making famous the mantra, “Greed is good”

At the time, I was head of credit research on bonds at Morgan Stanley, focusing on high-yield bonds. It was good that I was young – 10 years out of business school – because it was an exciting but exhausting time to be neck-deep in what was at the time the hottest asset class on Wall Street.
Part of our job was to try to anticipate what companies would be the corporate raiders’ next target. The purpose was not – as many investors might think – to get ahead of share-price action. Our objective was very different: to get ahead of possible rating downgrades… which would mean that the prices of the target company’s bond would get crushed. The bonds of the company being purchased would suffer because the buyer would borrow money to pay for their acquisitions… which they’d then load onto the target company’s balance sheet.
Only a few years earlier, the credit-rating agencies had added subgrades to their rating scales. For example, Standard & Poor’s A category was divided into A+, A, and A-. The agencies had come to believe that a downgrade all the way from A to BBB was too radical. But with companies’ debt leverage drastically increasing, it wasn’t unusual to see a rating down by two full grades, from A to BB, in one ruling. The devastating price impact of that kind of downgrade meant that I spent a lot of time tracking rumors about which company would be next to LBO itself, or to get taken over by a corporate raider.
This was all taking place in the context of an expanding economy that helped to keep the speculative-grade default rate at a moderate level, averaging 4.5% during 1985-1988. Under those ideal conditions, the high-yield total return averaged nearly 15% per year over the period. With their eyes focused firmly on the recent past, investors seemed to be serenely counting on the good times lasting indefinitely.
Naturally, they didn’t.
Overleveraged deals – in which companies took in far more debt than their cash flow generation could reliably repay – started going sour. Insider-trading revelations cast a cloud over financial markets. As GDP began to slow en route to the 1991 recession, the default rate climbed from 4.5% to 6% in 1989 and then to 10% in 1990, higher than in any previous year in Moody’s records going back to 1970. High-yield total return dropped to just 4% in 1989 and then plunged into the red at negative 4% in 1990.
It was a high-yield calamity.
Wall Street reeled as firms were forced to write-off bonds they held on their books. What made it far worse was a characteristic of the corporate bond market: Most of them don’t trade on an exchange. The market for corporate bonds is far, far less liquid (there’s less volume) than that for stocks. Instead of just matching buy and sell orders, brokerage firms buy bonds from customers who wish to sell – hoping a buyer will appear before their market price declines. In many situations, brokers might hold bonds on their books for weeks, anticipating a buyer… which in a down market is toxic.
Wall Street firms were also underwater on bonds they’d been stuck with from failed underwritings – that is, when the bank can’t sell all the bonds in a new issuance, usually resulting in a loss for the bank. The biggest casualty was the high-yield market’s biggest underwriter and market maker (and the fifth-largest investment bank at the time), Drexel Burnham Lambert. It filed for bankruptcy in February 1990, the first investment bank to do so since the Great Depression.
The collapse of Drexel precipitated a high-yield nuclear winter: not a single new high-yield issue came to market for the whole remainder of 1990. It was the Great Debacle.
An Exaggerated Death Report
On a road trip to meet with institutional investors during that long new-issue drought, I stopped into a diner for lunch in Kansas City and struck up a conversation with another patron, not an investment professional. He asked what I did for a living and I explained that I was a research director focused on the high-yield bond market. “What?” he exclaimed. “That market doesn’t exist any more!” You know things are bad when the average Joe at a diner in the Midwest knows of the demise of your sector.
My Merrill Lynch management colleagues had only a slightly more rosy assessment of high-yield bonds in the summer of 1990. The overwhelming consensus of those in a strategy session about the future of the firm’s high-yield business was that the high-yield bond issuance would never again reach its 1988 peak of $31 billion. (I was the lone optimist, asserting that volume could reach $10 billion a year.)
The jury of my peers was completely wrong, of course. A little more than a year later, new high-yield issue volume rebounded to nearly $40 billion in 1992. Since then, the annual figure has sometimes topped $300 billion, and is on pace for around $309 billion in new issuance this year.
How did the high-yield market recover – and why were the people who should have had the best insight on what was next so off target?
First, and most importantly, the financial carnage of the Great Debacle blinded the traders, salesmen, analysts, and bankers who were too close to the action from seeing that it was just another cycle… not an extinction-level event.
And second… realistically, the high-yield market was never going to disappear. It had (and continues to have) a distinct advantage: It’s an easier way to raise capital. Companies that don’t qualify for investment-grade bond ratings still need to issue debt… and the high-yield market conveniently doesn’t require the level of red tape and vetting needed in the private-placement market. (Private placements are bonds not subject to Securities and Exchange Commission registration, sold largely to insurance companies and not to individual investors.)
As anticipated, LBOs and hostile takeovers did recede as drivers of high-yield financing in the years following the Great Debacle. But the high-yield market didn’t die. In 1991, the first year following the Great Debacle, the high-yield return skyrocketed to 39% – with many of the issues that had been beaten down the most badly rebounding to return considerably more.
The lesson, by way of Rudyard Kipling: Keep your head when all about you are losing theirs.
We’ve been writing about how – contrary to what the Federal Reserve (and mainstream financial media) say – a recession in the U.S. economy may already be underway. That means that before long, it’s going to be the best possible environment for distressed investing – with distressed bonds the perfect counterweight as stocks suffer.
If you’re not already a subscriber of Porter & Co.’s Distressed Investing, go here. You can also call Lance James, our Director of Customer Care, at 888-610-8895, or internationally at +1 443-815-4447
Good investing,
Porter Stansberry
Stevenson, MD
P.S. Several decades ago, Marc Chaikin created a revolutionary tool to track the real money that’s behind a stock… it’s so powerful that the Bloomberg terminal – the financial data and insight service that every serious investment analyst on Earth has access to (they’re everywhere at banks, brokerages and hedge funds… at Porter & Co. we have three of them…) – built it into their system. And the Chaikin Money Flow indicator is still on Bloomberg – that’s how valuable it is.
Marc retired in 1999, feeling like his life’s work was complete. But the financial catastrophe that the 2008-2009 Global Financial Crisis was for normal people – Marc saw as his wife’s retirement account was tragically mismanaged by a so-called investment advisor – drew him back in. His new mission: Create an investment analysis tool that could help regular investors tap into the insight that he previously helped big institutions channel… and help protect them against market meltdowns.
The result was the Power Gauge. It collects and collates data from a vast array of sources, to look at price performance, fundamentals, insider buying, and expert consensus… all told, 20 different individual factors. And it does for any traded company in America, to give the user an overall reading on a stock.
When Porter saw Marc’s creation, he asked Marc to come under the Stansberry Research umbrella… to help Marc’s Power Gauge support as many investors as possible.
Today… Marc is seeing a big rotation of capital in the “smart money” – that is, large institutional investors – from the sectors that have been leading the market. He’s using his proprietary tools to capitalize on this rapid-fire shift over the next 12 months… and he’s put together this presentation to show investors how they can do it, too. Watch it here.
