
The Next Phase of the Bear Market will start with a Subprime Auto Credit Collapse, then a Commodities Crash and finally Consumer Panic.
Lucky Lopez buys repo’d cars.
He’s a 20-year veteran of the auto industry. As a car dealer and auction buyer, Lopez sits on the frontline of the auto financing market. He’s even got a YouTube Channel that’s popular with dealers.
According to Lucky prices are collapsing, and inventory is piling up, fast.
He believes the sudden turn in the market is going to hit subprime buyers and lenders hard. Lucky says, “in 2008 we had a housing bubble, and now we have an auto bubble.”
In recent years, bank lending standards for car loans “went out the window.” Lopez reports banks routinely offered auto debt with a “loan-to-value” ratio of 140%. This means banks would write a loan for 40% more than the value of the underlying vehicle.
Of course, this is bad business in any market. But in today’s car market, these loans are set for a spectacular collapse.
Here’s the story…
COVID-19 disrupted supply chains across the board. Including those for carmakers. Meanwhile, the stimulus bonanza gave incomes a jolt, allowing consumers to bid up a limited supply of vehicles.
That’s how the average new car price spiked to a record $47,077 by December of 2021. While used car prices jumped above $30,000 for the first time ever.
Recently, when those stimulus payments dried up, and real wages plunged, undeterred consumers binged on debt to finance ever-higher vehicle costs. Federal Reserve data shows the average consumer is taking out a record $38,000 in debt to finance new vehicle purchases, up 20% from 2019.
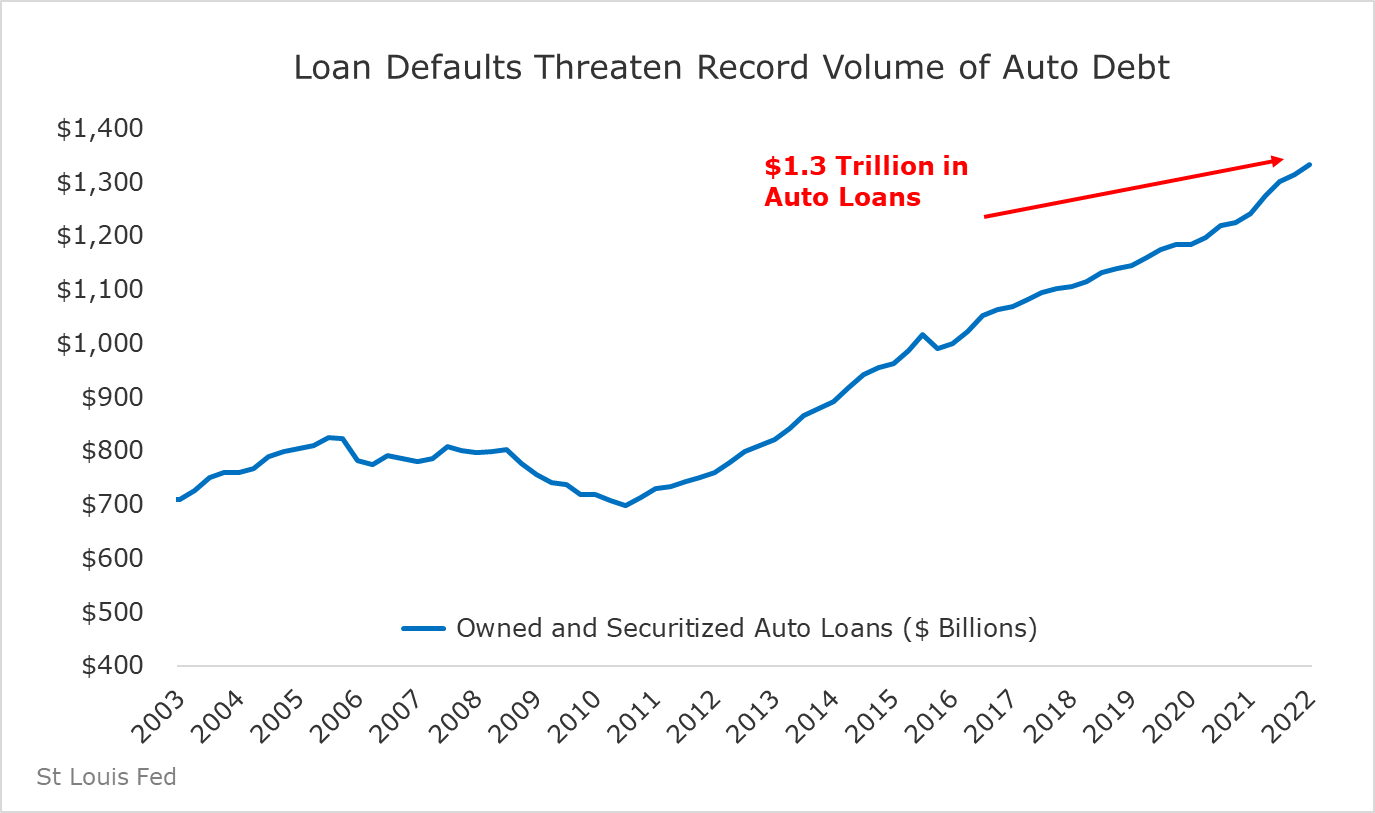
Car loans have become one of the largest and fastest growing segments of consumer credit in recent years. The volume of outstanding loans has doubled to over $1.4 trillion over the last decade. Today, autos make up the third largest source of consumer credit in America.
Lenders encouraged the boom by loosening up loan standards, including issuing loans to lower quality, subprime borrowers. They also kept monthly payments low by extending the duration of loans.
In the old days, the longest-term loan you could get for a vehicle was 48 months. After all, we’re talking about a depreciating asset. But lenders found they could suck people into buying more cars than they could really afford by offering a lower monthly payment through a longer-term loan.
It started with the introduction of 60-month car loans, which then grew to 72 months. Today, you can finance a car with an 84-month loan. That’s seven years.
And many Americans are doing exactly that. Experian data shows that 32% of new car purchases in the first quarter of 2021 were financed with loans ranging between 73 – 84 months in duration. Another 39% of loans were issued with terms between 61 and 72 months.
While these longer durations can help keep the monthly payments low, consumers ultimately pay a high cost – paying nearly twice the value of the vehicle in financing costs in some cases, like the example shown below:
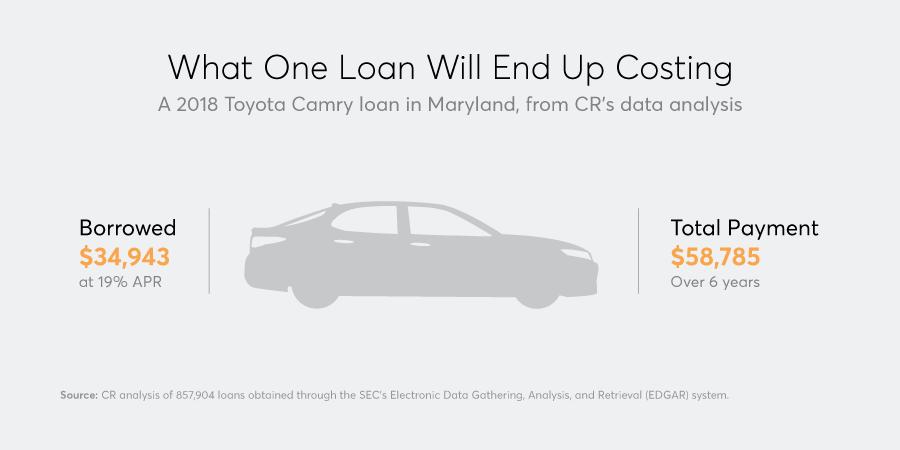
Meanwhile, a growing number of these loans were issued to subprime borrowers – those with poor credit histories. The percentage of subprime borrowers in the market has increased from roughly 10% of all auto loans in the 1990s to nearly double that number today.
How many of these subprime loans could go belly up?
Back in 2017, the Attorney General of Massachusetts claimed that one of the leading subprime auto lenders – Santander – estimated that 42% of its loans to Massachusetts residents were expected to default. Of course, the problems have only ballooned since then…
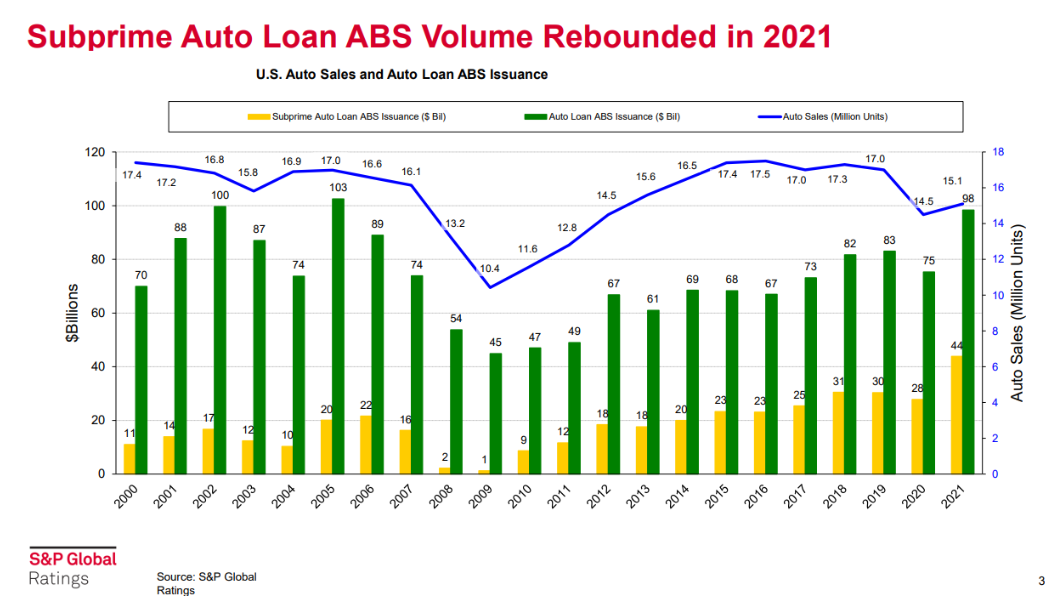
Last year, subprime auto issuance surged to $44 billion, or nearly 50% above the previous all-time high:
Just like the real estate boom of the early 2000s, a big contributor to this subprime auto lending fiasco is the lack of income verification. Consumer Reports analyzed over 800,000 loans from 17 major auto lenders and found that 96% of borrowers did not have their income verified.
The Consumer Reports analysis also showed the bulk of borrowers taking on more debt to finance their cars than they can afford. A common rule of thumb is that no more than 10% of a consumer’s monthly income should go towards an auto loan. But nearly 25% of the loans Consumer Reports analyzed blew past this threshold.
And perhaps the most eye-opening statistic of all – 46% of the loans in the Consumer Reports study were underwater on their loans. On average, consumers owed $3,700 more than the vehicle was worth.
All that debt is becoming hard to carry.
With inflation spiking to the highest levels in over 40 years, consumers are now getting squeezed by soaring costs for housing, gasoline, food, and other basic costs of living. They can no longer afford the outsized car loans that banks so generously extended during the boom.
As Lucky Lopez reports, he routinely sees consumers living on $2,500 a month carrying a $1,000 per month car payment. This was possible to pull off during the early stages of the stimulus bonanza in 2020 – 2021. But now, with stagnant wages and spiking inflation, it’s impossible.
Data from Experian shows default rates have surged. In 10 U.S. states, auto loan delinquencies have spiked above 10%. And in Washington D.C. an incredible 23.4% of all car loans are delinquent.
Meanwhile, repo companies are buying up vacant car lots to capitalize on the huge numbers of repossessions. And remember those banks who made loans at 140% of vehicle value during the boom?
Lopez reports seeing recovery rates as low as 70 cents on the dollar at recent auctions. That’s a 50% haircut. And we’re still in the early innings.
One of the secrets on Wall Street this week: The stakes are high. A record $1.3 trillion in debt is at risk from the coming meltdown in America’s auto loan market:
Hundreds of billions of dollars could go up in smoke. Of course, this won’t be a repeat of the 2008 mortgage crisis. Auto loans pale in size compared with the real estate market.
But it’s just one example of the massive scale of capital misallocation that occurred during this market cycle. We could soon see trillions of dollars in paper wealth evaporate, creating devastating ripple effects throughout the economy and financial markets.
In fact, it’s already playing out in front of our very eyes…
Reverse Wealth Effect
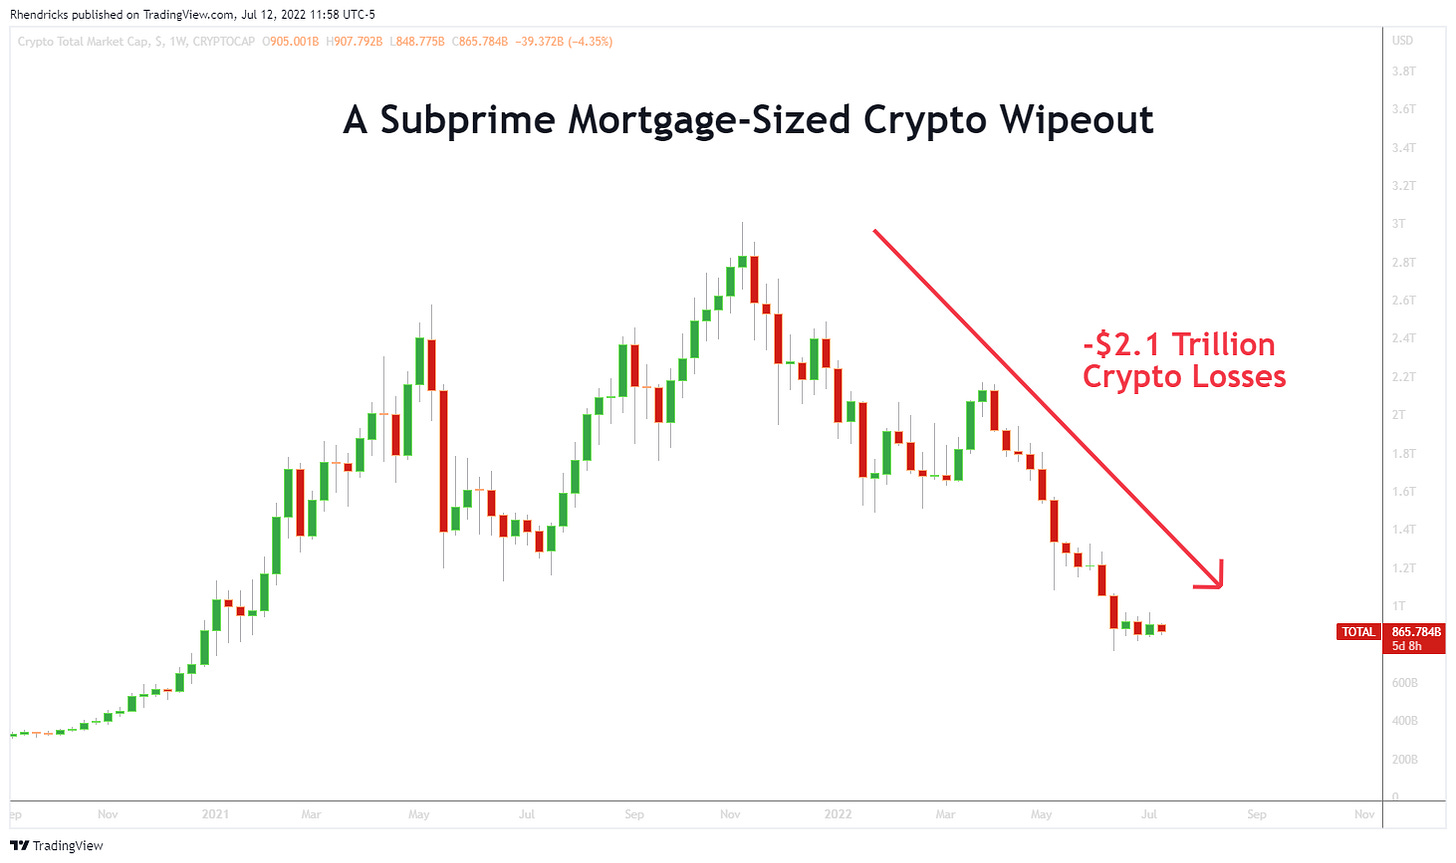
Take cryptocurrencies. At its apex in November of last year, the total crypto market capitalization reached a mind-boggling $3 trillion.
Fast forward just eight months later to today, and over $2 trillion of paper wealth has evaporated from the crypto market. For a frame of reference, the total value of all subprime loans was only $1.3 trillion at its peak in 2007.
In other words, we’ve just witnessed a subprime-sized implosion in cryptocurrencies alone:
During the crypto boom, soaring asset prices produced a powerful wealth effect that trickled down to all areas of the economy. Now with the crypto bust, a reverse wealth effect is taking hold.
Take for instance the “Rolex index” – a time series tracking prices of high-end watches. After enjoying a surge in prices alongside inflating asset valuations in recent years, high end watch prices are now rolling over as the liquidity tide recedes:
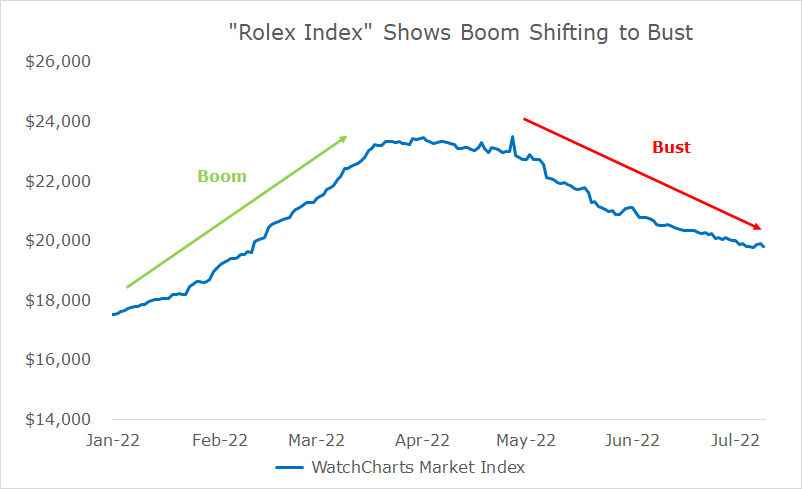
We also see clear warning signs in other asset prices and leading economic indicators pointing toward a recession…
A Late Cycle Economy on the Brink of Recession
Late cycle economic expansions follow a familiar playbook, where previously lose monetary policy pushes up commodities prices and inflation, forcing the central bank to tighten monetary policy. As the Fed raises rates, the spiking U.S. Dollar and higher borrowing costs put downward pressure on consumer incomes and corporate earnings.
We saw this same pattern precede each of the prior recessions and bear markets.
In the lead up to the Dot Com bust, oil prices tripled from $11 per barrel in in December 1998 to $37 by September of 2000. The Fed start raising rates, the Dollar spiked, and the Dot Com recession and bear market was in full swing by early 2001.
Likewise, commodities rallied across the board in the lead up to the Fall 2008 Financial Crisis. Oil famously ran to all-time highs of $147 per barrel in June of 2008, exerting tremendous pressure on consumer incomes at a time when the economy was already contracting.
In the summer of 2008, Wall Street and the Federal Reserve were fixated on inflation as a key economic threat. Of course, we all know what happened next… the global economy was less than three months away from plunging into one of the greatest deflationary busts of all time.
But for those paying attention, the writing was on the wall as far back as 2007.
A full 18 months before the Great Financial Crisis, subscribers to the Stansberry Investment Advisory received the following warning in December of 2007:
“With another 2 million homeowners facing higher interest resets on their adjustable-rate mortgages, it seems that the total number of defaults is going to keep climbing. And that’s trouble… I now believe our country’s mortgage crisis will spill over into the general economy.”
In that same issue, subscribers received the following advice:
“This is a time to be extremely cautious with your own finances. I believe the S&P 500 will fall this year, by more than 10%. Most stocks will probably decline this year. Thus, simply holding cash isn’t a bad strategy right now – your cash will probably outperform your stocks in 2008. Also, I think you should consider hedging your portfolio with some short sales – even if you’ve never done so before.”
And again, the following warning was issued in March of 2008:
“With the S&P 500 down 24% from its peak to its recent trough, we are in the midst of a real bear market. My belief today is stock prices – on average – are going to go lower. Perhaps even much, much lower… I don’t think we’ve seen the ‘throw in the towel’ moment.”
Finally, there was the call to short Fannie and Freddie on their way to zero, in the May 2008 issue:
“Fannie Mae and Freddie Mac, the two largest and most leveraged owners of U.S. mortgages are sure to go bankrupt in the next 12 months. Congress may decide to assume their liabilities, to prevent an unprecedented global financial calamity, but Congress won’t bail out the firms’ shareholders… I recommend you sell an equal amount of each stock short.”
While we’re not calling for another financial crisis today, we do see signs of epic economic distress and a recession looming on the horizon. With inflation soaring to the highest levels in over 40 years, central banks around the world are being forced into the most aggressive monetary tightening campaign of our generation.
Earlier this week, the U.S. consumer price index came in at a blistering 9.1%. Now, Wall Street is pricing in a rate hike of 100 basis points at the Fed’s next meeting – the largest rate hike since 1984.
Asset prices have begun correcting in the face of weak economic data and the Fed’s aggressive tightening campaign, with U.S. stocks officially in bear market territory. But we believe there’s more pain to come.
Which for you – it’s great news.
First though, about that pain…
In addition to the distress in the subprime auto market, consumers have taken on record levels of credit card debt to counter the cost-of-living crisis. In the wake of the COVID stimulus bonanza, consumers initially used the extra funds to pay down credit card debt. But this trend reversed in early 2021 when the stimulus money stopped flowing and inflation picked up.
Today, consumers are saddled with a record amount of high interest credit card debt:
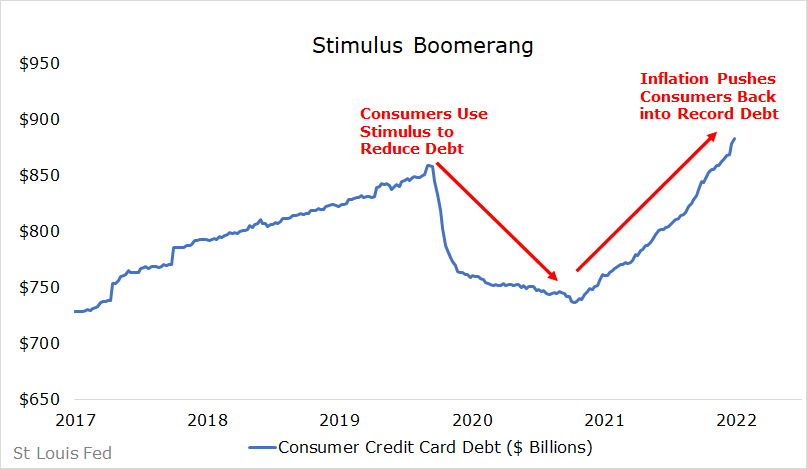
This sets the stage for a coming wave of defaults, and lower consumption, as the economic downturn accelerates.
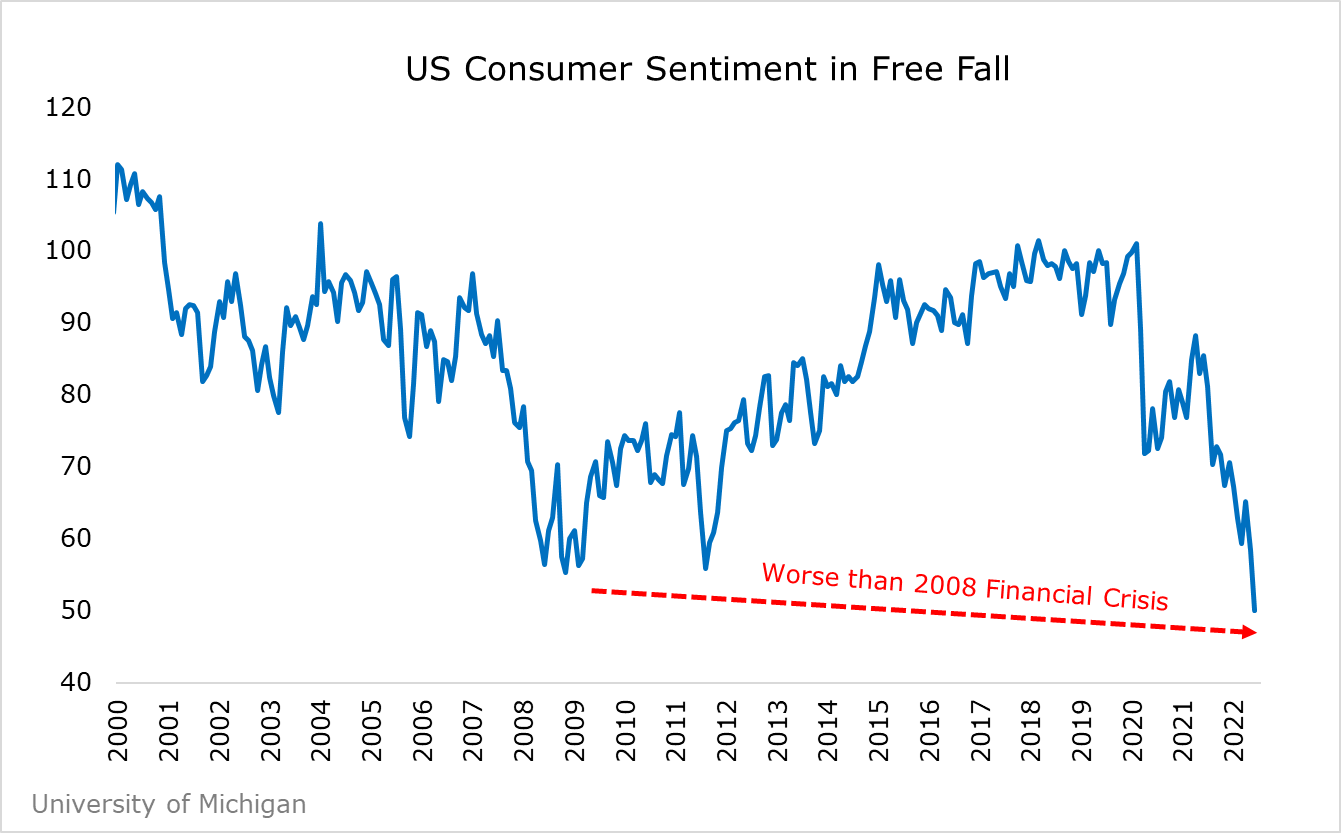
We already see extreme distress via collapsing consumer sentiment – a key leading economic indicator, showing worse conditions today than at the depths of the 2008 Financial Crisis:
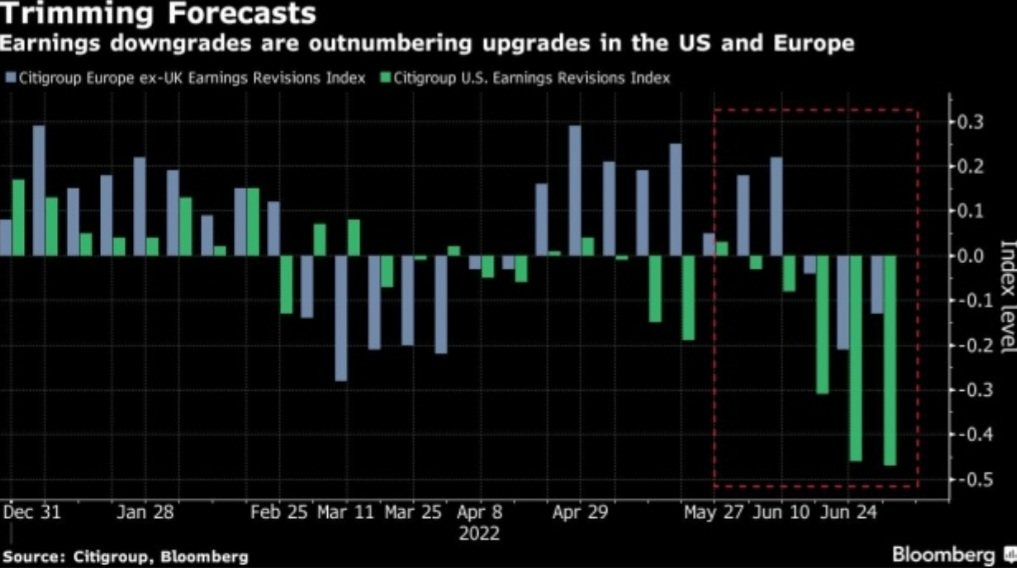
It’s only a matter of time before today’s weak consumer activity shows up in corporate earnings. Already, analysts have been busy downgrading their estimates for the upcoming second quarter reporting period. With stocks already in an official bear market (i.e., 20% off their highs), the market appears to be pricing in an imminent hit to corporate earnings:
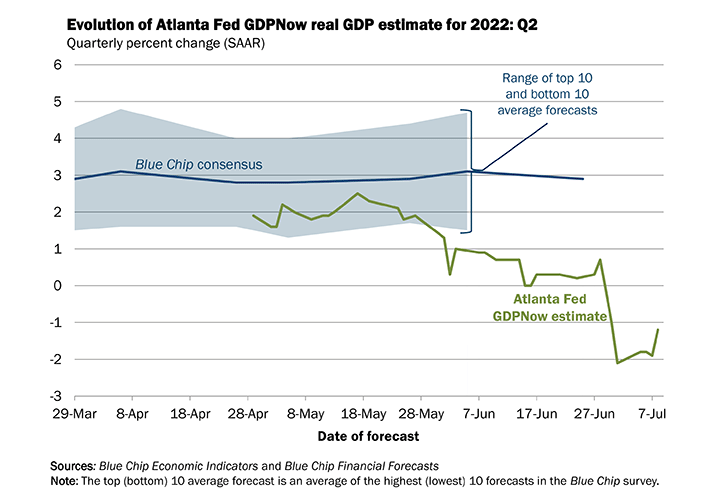
The U.S. economy contracted by 1.6% in the first quarter, and it’s very possible that we may have already entered a recession.
Of course, Wall Street economists have so far brushed off the bad news and currently forecast a full rebound to economic growth in the second quarter. But the indicators we track show little to no signs of improvement, including the real-time GDP forecast from the Atlanta Federal Reserve:
Finally, there’s one of our favorite economists: Dr. Copper, along with other key base metals like aluminum, which provide reliable leading indicators as key material inputs throughout the economy.
Base metal prices have collapsed across the board, approaching levels last seen in 2020 – back when the global economy was struggling to emerge from COVID lockdowns:

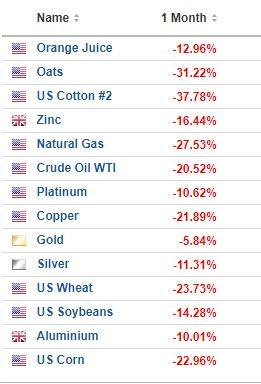
And it’s not just base metals putting up warning signs. Commodities ranging from energy to agriculture, and everything in between, have entered a tailspin in recent weeks:
The flipside of the commodities collapse is the spiking U.S. Dollar – another consequence of Fed tightening and a general flight to safety among investors:

U.S. companies in aggregate generate roughly a third of their earnings offshore. So, a higher U.S. Dollar presents yet another headwind for corporate earnings, and thus stock prices, in the months ahead.
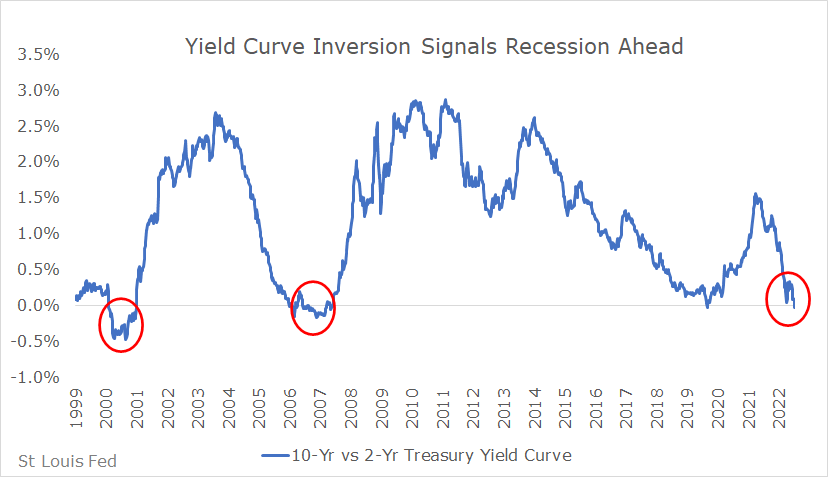
Finally, the single most reliable indicator of an upcoming recession is flashing bright red: the Treasury yield curve.
The spread between the 10-year and 2-year Treasury yield has inverted before every recession since World War II. That’s why the following chart should put all investors on edge, as the yield curve has officially inverted:
Here’s the bottom line in all this…
The most inflation in over 40 years has crushed consumer incomes, forcing the Fed into an aggressive rate hiking cycle. Defaults are spiking while leading economic indicators have turned down across the board.
And Mr. Market is telegraphing economic turbulence through the collapsing prices of commodities, stocks and bond yields while sending the safe haven U.S. Dollar soaring into the stratosphere.
There aren’t many more boxes left to check for a late cycle economy transitioning from boom to bust.
So, what does this mean for you and your money?
Remember that great news we mentioned? When an economic storm of this magnitude hits – that’s when you get generational opportunities to buy world class businesses at fire sale prices.
Warren Buffett explains it best, “Every decade or so, dark clouds will fill the economic skies, and they will briefly rain gold.”
In this issue, we’re taking our cue from the world’s greatest wealth compounder – Warren Buffett. We’ll quickly revisit Buffett’s incredible long term track record. Along with the secrets that made it possible.
Then we’ll share with you a list of our own Buffett-style, world dominating businesses.
These are hand-picked companies that meet our strict criteria of capital-efficient, world-class brands with pricing power and impenetrable moats. We’ve put them on our “bear market buy list” as stocks we hope to buy at fire sale prices when the bear market kicks into high gear.
But first, let’s step back and understand exactly what it is about Buffett’s style that makes his track record so great.
The World’s Greatest Wealth Compounder
Any fund manager can have a great month, great quarter or even a great year. The legends are the ones who can do it for decades.
That’s where Buffett really shines.
Quantitative investment firm AQR shows this by zooming out and ranking Buffett’s Berkshire performance against fund managers and common stocks that have existed for at least 10, 30 and 40 years.
The data shows Berkshire ranks #1 among all funds that have existed for at least 40 years. It also ranks #1 out of the 1,111 public stocks that have existed for at least 40 years:
Simply put, there’s been no better (public) place to put money than with Warren Buffett over the last 40 years.
If you invested $1,000 in Berkshire Hathaway in October 1976, that investment grew to more than $3,685,000 by March 2017. And all you had to do was buy and hold Berkshire common stock.
The paper notes that one key factor behind Buffett’s success was his ability to “stay the course” whereas others may have been forced out of business due to temporary periods of poor performance (such as when Buffett lagged the S&P 500 during the late 90’s tech boom).
He achieved this by structuring Berkshire as a corporation with a permanent source of cheap capital. Which introduces the next secret to Buffett’s track record…
Dirt Cheap Leverage
AQR’s analysis breaks apart Buffett’s alpha into two components: leverage and stock picking.
AQR estimates Buffett’s average leverage between 1.4x – 1.7x.
The first notable thing is the ultra-low cost of this leverage, thanks to his use of insurance “float” as a cheap source of borrowing. AQR estimates Berkshire’s cost of insurance float over the sample period came in at just 1.72% or about 3% below T-bill rates.
Compare that with your average fund manager (or corporation) that likely pays some rate above T-bills to borrow money. This alone explains a non-trivial amount of Berkshire’s historical alpha.
AQR also notes another source of cheap financing – Berkshire’s ability to finance capex with tax deductions through accelerated depreciation, which acts like an interest free loan. AQR cites $28 billion of deferred tax liabilities in 2011 from accelerated depreciation.
Finally, the AQR analysis also notes Berkshire sells put options on stock market indices – basically another form of insurance underwriting, where you receive upfront cash in exchange for agreeing to buy a stake in American businesses in the future at a discount.
In summary, through insurance underwriting and tax advantages, Buffett secured billions in ultra-low-cost financing over the years. One illustration cited for the low financing rates Buffett enjoyed was the fact that Berkshire issued the “first ever negative-coupon security in 2002.”
Of course, leverage alone doesn’t explain all the outperformance. AQR notes that if you apply the same 1.7x leverage to the broader stock market, it only generates an average excess return of 12.7% (i.e., 12.7% above the rate of T-bill returns), compared with Berkshire’s average excess return of 18.6%.
To explain the rest, we go to point number four – Buffett’s stock picking ability.
Buy High Quality Stocks at Attractive Prices
AQR breaks down the performance of Buffett’s public securities and uses a proxy measurement to estimate the performance of privately held Berkshire securities.
The first notable finding is that Buffett’s public stocks outperformed the estimated performance of private companies. This implies Buffett’s skill mostly comes from his stock picking ability – not from influencing management teams.
From there, the factor analysis indicates that Buffett does not generate any excess returns from the alpha associated with small stocks – as Berkshire favors large-cap stocks. The factor analysis also shows Buffett gets some excess returns from buying “cheap” stocks – but this is not the primary alpha generator.
Instead, AQR shows what many academics have missed historically: that most of Buffett’s stock picking alpha comes from simply buying safe high-quality stocks at reasonable prices.
We have studied Buffett’s letters extensively for the past 25 years – all of them. As far as we know there is no better or more practical guide, anywhere, to understanding rational investing. It was Buffett who taught us about capital efficiency and how it can confer a truly unbeatable advantage to any investor wise enough to seek it out and patient enough to exploit it.
We believe anyone can learn to invest like Warren Buffett, and that’s the inspiration for today’s issue…
Building Your Own Berkshire Quality Portfolio
Buffett is normally reluctant to offer specific investment advice, but he broke with tradition in his 1996 letter. In this letter, and only in this letter, he addresses individual investors explicitly and offers specific advice on building a portfolio.
“Should you choose to construct your own portfolio, there are a few thoughts worth remembering… Your goal as an investor should simply be to purchase, at a rational price, a part interest in an easily understandable business whose earnings are virtually certain to be materially higher five, ten and twenty years from now. Over time, you will find only a few companies that meet these standards – so when you see one that qualifies, you should buy a meaningful amount of stock… Though it’s seldom recognized, this is the exact approach that has produced gains for Berkshire shareholders.”
— Warren Buffett, 1996 Letter from the Chairman
Buffett describes these kinds of businesses as “Inevitables.” They are businesses whose competitive advantages are so obvious and entrenched it’s hard to imagine even a well-financed competitor making much of a dent in their margins.
As Buffett wrote:
“Companies such as Coca-Cola and Gillette might well be labeled “The Inevitables.” Forecasters may differ a bit in their predictions of exactly how much soft drink or shaving-equipment business these companies will be doing in ten or twenty years… In the end, however, no sensible observer – not even these companies’ most vigorous competitors, assuming they are assessing the matter honestly – questions that Coke and Gillette will dominate their fields worldwide for an investment lifetime. Indeed, their dominance will probably strengthen. Both companies have significantly expanded their already huge shares of market during the past ten years, and all signs point to their repeating that performance in the next decade.”
— Warren Buffett, 1996 Letter from the Chairman
Twenty-five years later, we can tell you, from direct experience, competing with Gillette is exceptionally difficult. Porter has invested almost $10 million over the past decade in developing a high-tech, single-blade, safety razor (www.onebladeshave.com).
Despite offering a premium razor with significantly better materials (316L steel, military grade PVD coatings), innovative design (that’s patented) and revolutionary functionality, OneBlade isn’t yet even remotely a threat to Gillette.
As for Coke, in the 25 years since Buffett wrote his “Inevitables” letter, the company sold almost $800 billion worth of soft drinks, generating cash profits of nearly $200 billion – earning $0.23 in cash for every dollar of products sold.
The company did so while increasing its dividend every year (last year by 17%!) and paying out over $100 billion in total, while also reducing outstanding shares by 12%.
Even now, 25 years later, nothing approaches Coke’s global dominance in non-alcoholic beverages. The company still has a 25% net income margin, with double-digit returns on assets and invested capital. It’s annual returns on equity are almost always above 40%. As a business, it is a steamroller.
That is, of course, why Coke’s shares rarely trade at a reasonable price. Buffett bought his enormous stake in the fall of 1987 after the market’s crash, buying for around 10 times earnings. The opportunity was so big he put 25% of Berkshire’s entire portfolio into the stock.
Normally, businesses like this trade for a hefty premium… and for good reason. High returns on invested capital and a wide moat insulating their businesses from competition means that “Inevitables” can out-earn and out-return the average stock by a mile.
But every once in a while, an outside event – like a financial panic or a deep recession – provides the rare chance for you to buy quality merchandise at fire sale prices…
We believe such an opportunity is at hand.
We want to help prepare you and put you on the path to inevitable wealth.
That’s why we’ve spent the last few weeks combing through the data and creating a unique quantitative screen to filter for capital-efficient companies with high profitability and high returns on invested capital.
We then further filtered down the list based on a qualitative view of the business’s competitive position and durability of its moat.
From more than 10,000 available public securities, we’ve narrowed the list down to just 15 of the best businesses in the world.
Here’s what we found…
This content is only available for paid members.
If you are interested in joining Porter & Co. either click the button below now or call our Customer Care team at 888-610-8895.