Issue #130, Volume #2


This Massive Bull Market Will Either Burn Out Or Freeze Up
This is Porter’s Daily Journal, a free e-letter from Porter & Co. that provides unfiltered insights on markets, the economy, and life to help readers become better investors. It includes weekday editions and two weekend editions… and is free to all subscribers.
Fire or ice… Stocks are expensive as ever… CAPE ratio above 30… Credit markets in Lake Wobegon… Gold is the stalwart… Americans keep buying stocks… Private credit crack-up…
Massive bull markets (like this one) don’t last forever.
Since the early 1970s, when we moved to paper money, three major bull markets have ended in “fire” – an overheating economy, where soaring inflation causes interest rates to spike. And three major bear markets were caused by “ice” – a sudden deflationary collapse.
Fire burned the market down in 1973 (48% decline), 1980 (27% decline), and 2022 (25% decline).
And ice (deflationary forces) sent stock prices crashing and government bond prices soaring in the dot-com crash (49% decline), the Global Financial Crisis (56% decline), and the COVID crash (34% decline).
One or the other is coming for us.
Rampant asset inflation has pushed asset prices to levels we’ve rarely seen before in history.
Economist Robert Shiller designed the CAPE (cyclically adjusted price-to-earnings) ratio to help understand the longer-term cycles in equity markets. Rather than measuring stock prices against a single year’s earnings, Shiller measures the average earnings, adjusted for inflation, over the past decade and then measures those earnings against equity prices.
While the CAPE ratio isn’t a market-timing tool, it is an excellent predictor of future equity returns over the long term. Vanguard studied equity investing outcomes from 1926-2011 and found actual long-term (10-year) equity market returns are flat when the CAPE is over 25.
Moneco Advisors recently updated this study through 2024 and found the starting CAPE level was responsible for 80% of long-term equity returns.
For investors buying stocks at CAPE ratios over 30, future negative returns are inevitable – on average.
Today’s CAPE ratio on the S&P 500 is 39.7.
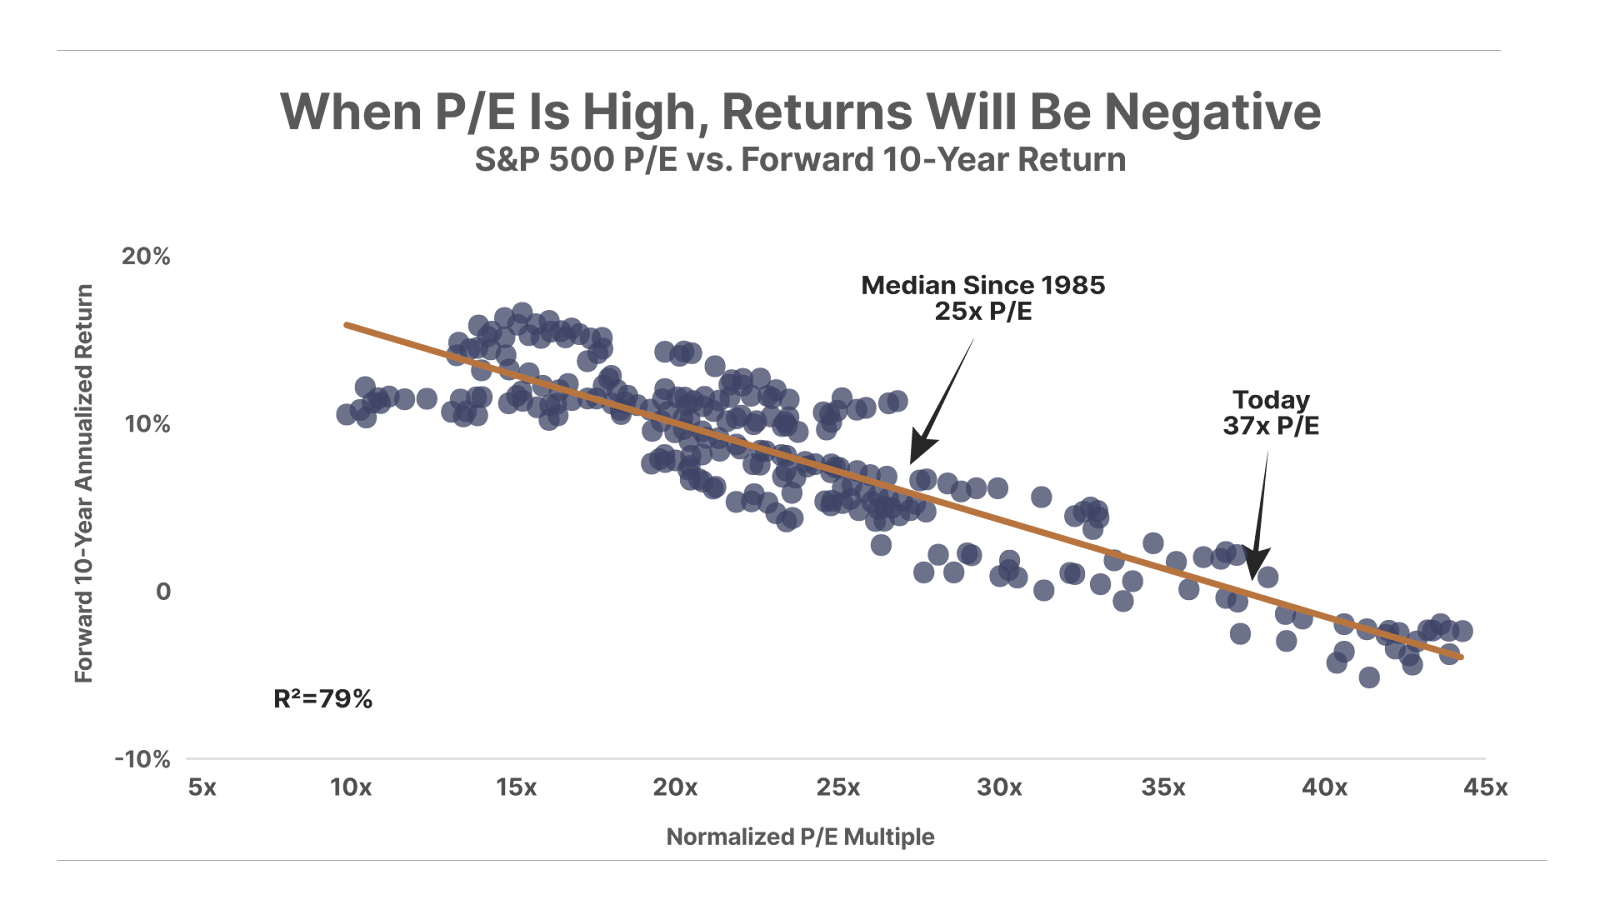
This is among the highest levels ever recorded. Among the very few times stocks were more expensive was during the internet bubble in 2000 (CAPE peaked at 44) and very briefly during the post-COVID boom in 2021.
Extremely high equity prices mean it will be virtually impossible for most investors to earn anything in stocks, on average, over the next decade. And, adjusted for inflation, it’s overwhelmingly likely that most investors will lose a lot of money, on average, over the next decade.
That doesn’t mean that stocks won’t continue to go up in the short term. What it means is that it’s a heck of a lot harder to do well as an investor when you’re buying at all-time highs. As Warren Buffett says, “Investors pay a high price for a sunny outlook.”
Likewise, the credit markets are signaling that our economy has rarely, if ever, been in better shape.
In the credit markets, a perfect economic fantasy land has emerged – a Lake Wobegon of debtors, all of whom are above average and none of which could ever default.
Virtually all of the leading credit indices are trading at all-time “tight” spreads.
In the credit markets, credit risk is priced against similar duration U.S. Treasury bonds, as the market assumes that the U.S. Treasury will never default. The ICE BofA Investment Grade (Overall) Master OAS Index includes all publicly issued, investment grade (AAA to BBB-), fixed-rate, U.S.-dollar-denominated corporate bonds with at least $250 million in outstanding issuance and more than one year to maturity. This index also strips out the value of any embedded call or put options in these bonds. That’s why it’s called an OAS index: Option-Adjusted Spread. This gives investors a clean, apples-to-apples comparison between investment-grade corporate bonds and U.S. Treasury bonds. And looking at the difference in annual yield between these two kinds of bonds, at the same “constant” maturity, tells you how much default risk investors are pricing in corporate bonds.
Today, the risk premium in investment-grade corporates as measured by this comprehensive index is only 75 basis points (0.75%). That’s near an all-time low.
In short, investors don’t believe the default rate on these bonds will be over 1% – ever.
Similar indexes exist for different types of bonds and at different credit ratings. For example, corporate bonds with a single A rating are now trading at a spread of 66 basis points – very near all-time-low risk premiums. (The recent high spread in these bonds was 600 basis points in 2008).
High-yield corporates (bonds that don’t have an investment-grade rating) were trading at a spread over Treasuries of only 250 basis points (2.5%) in September. The record low is 241 basis points, in 2007, just before the financial crisis.
Across the entire credit spectrum, yields are both as tight as they get and extremely low relative to inflation.
Thus, just as we see in stocks, investments in fixed-income securities are likely to be disappointing relative to credit risk and inflation.
That leaves gold.
Historically buying gold at financial-asset pricing peaks has been a great way to diversify and avoid major drawdowns.
In this cycle, the Shiller CAPE index first went above 30 on February 8, 2021, following the massive post-COVID market rally. This is the longest sustained 30+ CAPE market (1,737 days) since the dot-com era (1998-2002).
If you bought gold on February 8, 2021, you paid $1,813 per ounce. Today gold is trading around $4,100. That’s a 126% total return, or 20% a year. Stocks have continued to do well too, but gold has done much better. Gold has done its job of protecting your wealth from financial manias.
Likewise, if you bought gold when the Shiller CAPE index first went over 30 on October 14, 1998, and held it for five years – through the dot-com crash – you would have avoided an enormous bear market and seen your gold go from around $300 an ounce to almost $400. By 2006 it was almost $600.
The trouble is that gold has done so well that it’s trading at prices that don’t seem sustainable. Gold miners have never seen margins this wide! The All-In Sustaining Costs (“AISC”) for gold mining is currently about $1,500. And the better quality miners have even lower production costs. Agnico Eagle (AEM) – my favorite gold miner – mines gold at $1,289 per ounce.
But increasing production isn’t easy. Despite the incredible margins, production isn’t expected to increase meaningfully in 2026. And gold production is actually likely to decline over the next several years. There hasn’t been a new U.S. mine built since 2002.
All of this can’t go on forever… but how will this cycle end?
Will larger government deficits lead to soaring inflation, much higher interest rates, and a bear market in financial assets? Real inflation is running at least 10% a year in most cities. It isn’t hard to imagine that eventually bond market investors will say “enough” and simply refuse to lend at rates that are below inflation.
With $38 trillion in debt (up $2.2 trillion in the last year), the federal government can’t possibly afford to pay real interest rates. The weighted-average interest paid on government bonds is only 3.4%. And sure, that’s a lot more than the 1.5% the government was paying during COVID, but it still isn’t nearly enough to prevent losses to investors from inflation.
Imagine if the government was paying a real interest rate – like 7%. That would mean $2.5 trillion in interest expense… against total income tax receipts of $3 trillion. As you can see, it wouldn’t take much skepticism in the bond market to bankrupt the government, which would print, print, print to pay its bills.
Or… there could be a deflationary collapse, as lots of commercial real estate, subprime auto loans, and private credit loans default. That would give the government some breathing room in the bond market. There are worrisome signs of credit “rolling over.” Subprime auto loans are now in deep distress, with 60-plus-day delinquencies over 6.5% of all loans – a higher default rate than occurred during the Global Financial Crisis. Auto repossessions are expected to hit 3 million vehicles this year. It’s unusual to see so many auto loan defaults before a recession begins.
What’s behind these problems?
I believe the resumption of student loan collection efforts (May 2025) is having a major impact on consumer credit and consumer spending.
There is an enormous amount of credit outstanding to these borrowers: $1.6 trillion outstanding to 42.5 million borrowers. Most of these people are under 40. Various forms of forbearance and COVID-era payment suspensions have hidden the impact of these debts.
Before COVID, about 5 million of these borrowers were in default on around $120 billion in loans. But the size of the default population is now set to explode. There are an additional 5 million borrowers who are in default (more than 180 days delinquent), but whose defaults have not been recognized yet. And there are millions of other borrowers who are likely to default in the next year.
In total more than 30% of the outstanding loans are more than 90 days past due.
Defaults trigger wage garnishment, tax refund seizures, and credit ratings downgrades. More or less, default puts the borrowers out of the consumer economy. As defaults more than double over the next six months, there will be a substantial decline in consumer demand.
These risks haven’t hit consumer credit more broadly… yet.
Looking at Capital One’s most recent report, provisions for credit losses remain very low. The company booked a $2.7 billion provision for credit losses, against a loan portfolio of $439.9 billion (0.61%). Annualized that’s 2.4%, which is in the low end of the credit-loss range. Normal credit losses are 3% to 5% of the portfolio, with peak loss rates during recessions above 10%. And the company released $760 million from its credit-loss reserve because credit losses have been less than expected.
For now, I think the credit markets are going to remain strong.
And so when I look at the two risks – fire (an overheating economy) and ice (a credit collapse) – I think fire is the most likely scenario. Why?
Because the government makes up so much of our economy.
Consider this: Government spending is now almost half (47%) of our entire economy. Total government spending (state, local, federal) is more than $13 trillion per year. Our entire economy is $27.6 trillion annually. People complaining about the risks of socialism don’t seem to realize that it’s already here. We’re living in it.
It’s easy to get lost in these numbers. Here’s a better way to visualize what this really means.
There are 130 million households in the United States. The real median household after-tax income for 2024 was $72,300. That’s the actual midpoint, where half the households make more and half make less. The median income household spends about $4,000 per year on federal income taxes (on average). That’s because of the standard deduction ($29,200 for married filing jointly) and child credits, etc.
But government spending per household is $96,000.
There’s no way to make this math work. In theory, you can live at the expense of your neighbor for a while, but this gap – paying $4,000 a year and getting $96,000 a year – simply can’t go on for very long.
Often in investing, it’s the simplest ideas that work the best.
My bet is gold continues to outperform stocks. Two reasons:
-
Our government’s finances are completely out of control
-
Financial assets won’t weather the coming collapse of the dollar-based financial system nearly as well as gold does
One final point…
Out of the six major bear markets we’ve seen since the adoption of paper money, gold performed well in five out of the six.
-
Although it was illegal for Americans to own gold until January 1, 1975, gold prices went up 84% during the 1973-1974 bear market when stocks fell in half
-
We’ve already seen how gold performed during the 2000-2002 dot-com bust, moving from $300 to $400
-
In 2008, while gold fell initially, gold prices rallied 23% from October 2008 through the bottom in March 2009, while stocks fell by more than half
-
During the COVID crash (February 19, 2020, to March 23, 2020) stocks fell 34% in 33 days, the fastest bear market of all time. Gold was down less than 3%
-
During the inflationary crisis of 2022, gold held firm and was up 1% on the year while stocks fell 25%
The only major bear market gold didn’t protect investors from (since the advent of paper money) was the 1980-1982 bear market. Stocks fell almost 30% from late 1980 through August 1982. This was a “fire” bear market. Inflation hit 15% in March 1980 and Fed Chair Paul Volcker responded by raising the Fed Funds rate to an incredible 22%. Three-month T-bills averaged 15% yields for two years. Unemployment reached double digits.
Gold, which had rallied strongly in the late 1970s and hit a peak of $850 on January 21, 1980, crashed to $300 an ounce by the fall of 1982. Gold wouldn’t enter another substantial bull market for 20 years, as the Federal Reserve maintained substantial real interest rates in government bonds.
Today, I don’t think there’s any risk, at all, of that happening. The government can’t afford it.
If you’re going to remain in the markets, make sure you’ve got plenty of gold.
And if you’re going to remain in the markets, sign up for The Big Secret On Wall Street… Porter’s flagship publication that provides access to more than three dozen recommendations, Porter’s latest financial analysis, and Best Buys, three portfolio companies trading at an attractive share price. Go here to learn more now.
Gold Dethrones The Euro… Is The Dollar Next?
Gold recently surpassed the Euro to become the world’s #2 reserve asset. Central banks are buying record amounts — and yet, gold miners are still dirt cheap.
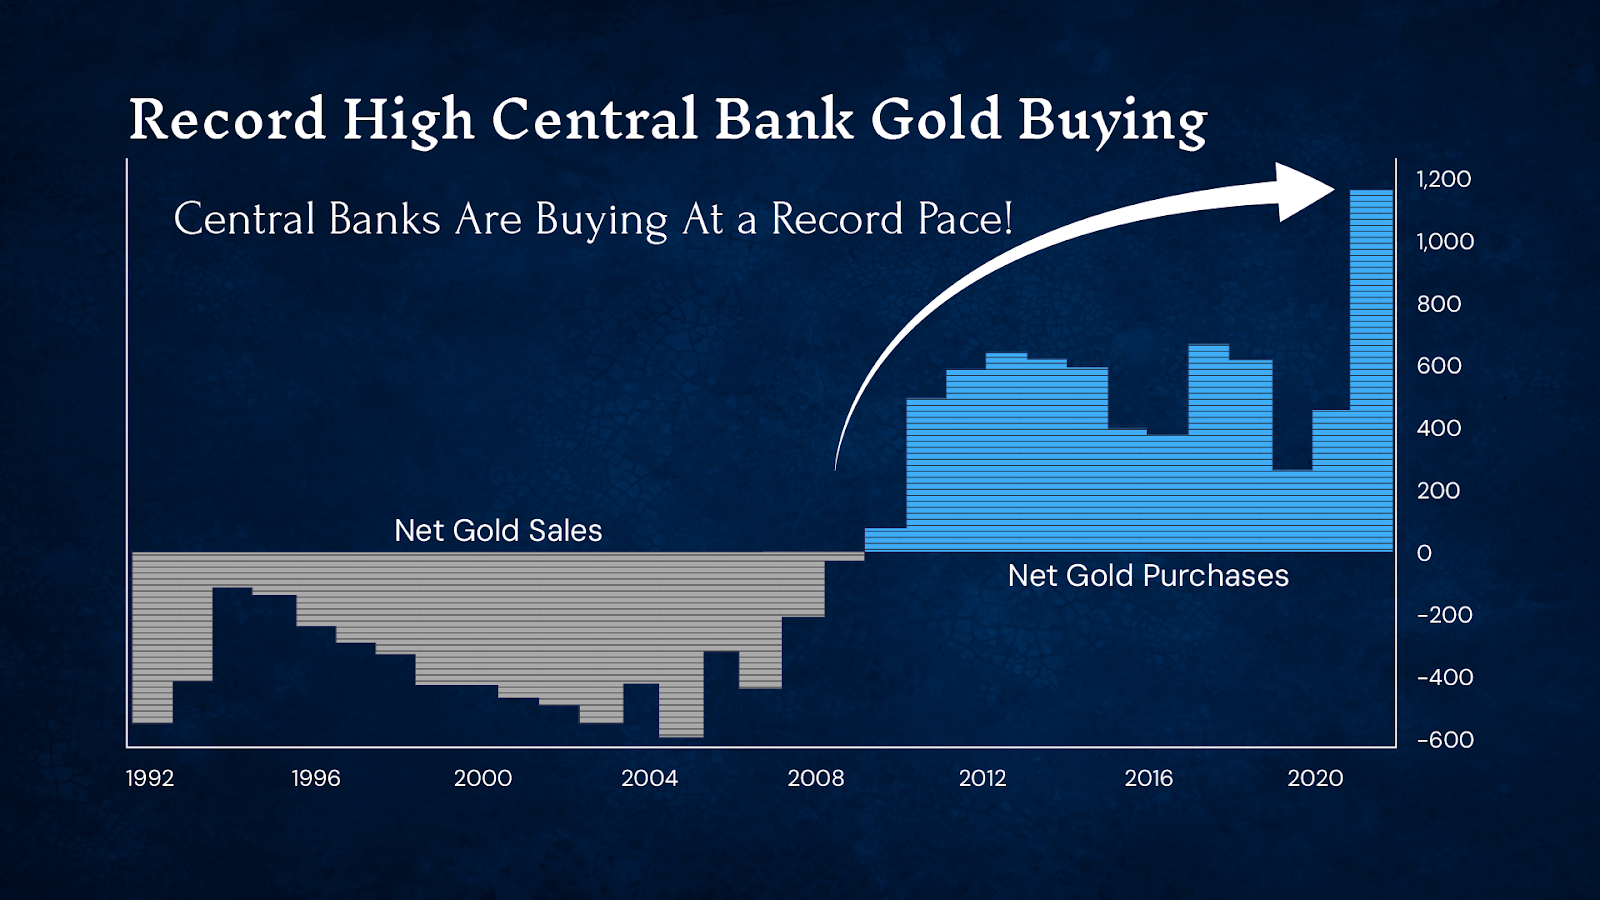
This is your chance to ride gold’s return to the monetary system – and make a potential generational fortune.
Click here to get details on Garrett’s top 30 miners, already handing investors gains of 441%, 446%, 618%, 784% and more since January 2024.
Three Things To Know Before We Go…
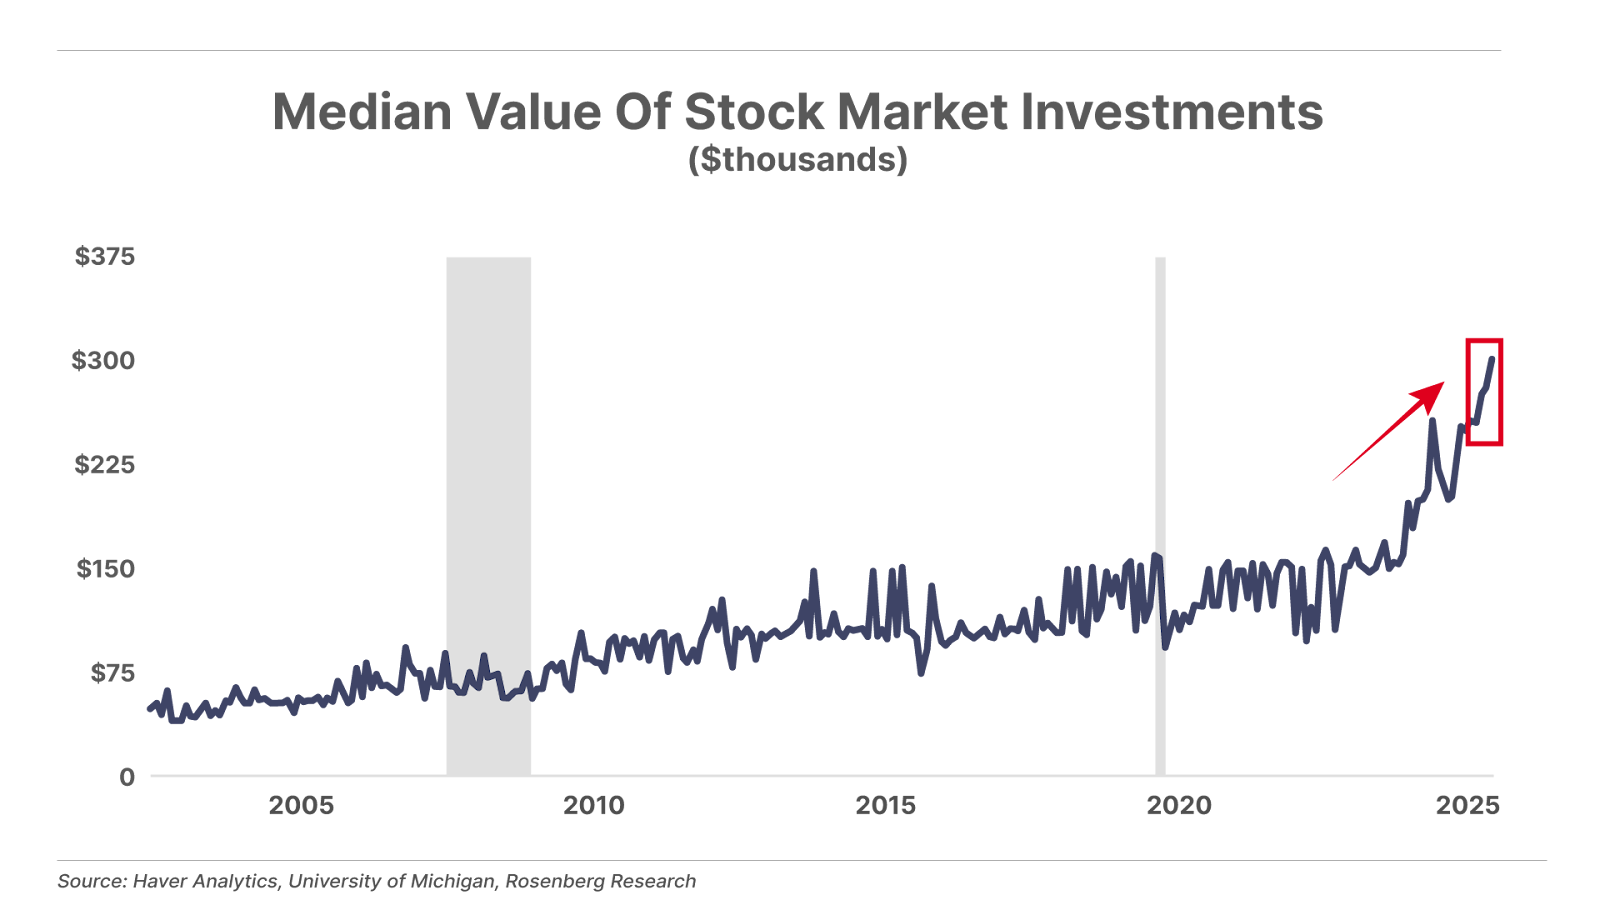
1. Americans have more exposure to stocks than ever before. According to the latest University of Michigan consumer survey, the median value of U.S. investors’ stock market holdings has surpassed $300,000 for the first time. This sum has more than tripled since April 2020 and is up 50% since March of this year. Equities now account for a record 52% of U.S. household wealth, roughly five percentage points above the prior record set during the 2000 dot-com bubble peak.
2. Venture Global (VG) builds momentum. The liquefied natural gas (“LNG”) exporter, which Porter wrote about in June, just reported exceptional quarterly results. Revenue increased 260% year-over-year, fueled by record output from its Calcasieu Pass and Plaquemines LNG projects. Alongside these results, Venture Global announced a 20-year agreement to supply 1 million tonnes per annum (“MTPA”) of LNG to Spain’s multinational utility company Naturgy beginning in 2030, strengthening its European presence and helping replace Russian supply. This agreement and the company’s quarterly results underscore Venture Global’s position as a leading supplier of affordable, reliable long-term energy to global markets.
3. Another blow up in private credit. On October 31, we explained why a recent series of high-profile losses in the private credit market signaled the start of an historic credit bust. And the hits keep coming. Last week, lending giant BlackRock wrote down to zero a private loan made to home-improvement company Renovo Home Partners. As recently as last month, BlackRock valued the loan at 100 cents on the dollar. When one of America’s largest, most sophisticated lenders takes a 100% loss on a loan over the course of one month, it should sound alarm bells across Wall Street.
Tell us what you think of today’s Daily Journal or anything else that is on your mind: [email protected]
Mailbag
Many readers wrote in to respond to Friday’s Daily Journal, when Porter wrote:
“Social Security will collapse before the end of this decade.”
You scared the hell out of me, Porter, with your doomsday Social Security scenario in five years and everything else that will go with it. Thanks for sharing that reality and your insight.
Dave G.”
Adding funding to Social Security will simply result in more debt and thus more money printing thus even higher inflation. Social Security checks won’t stop or even be cut, but the value of the dollars paid out will be considerably less.
Tim P.”
I have been reading your work for about 15 years and I’m currently a Partner Pass member.
I appreciate you bringing up Social Security and the U.S. debt crisis again. It does appear to be not only scary, but there seems to be no way to stop the speeding train.
Bill B.”
How do we get high schools and colleges to teach about the end of Social Security?
Jim H.”
Good investing,
Porter Stansberry Stevenson, Maryland
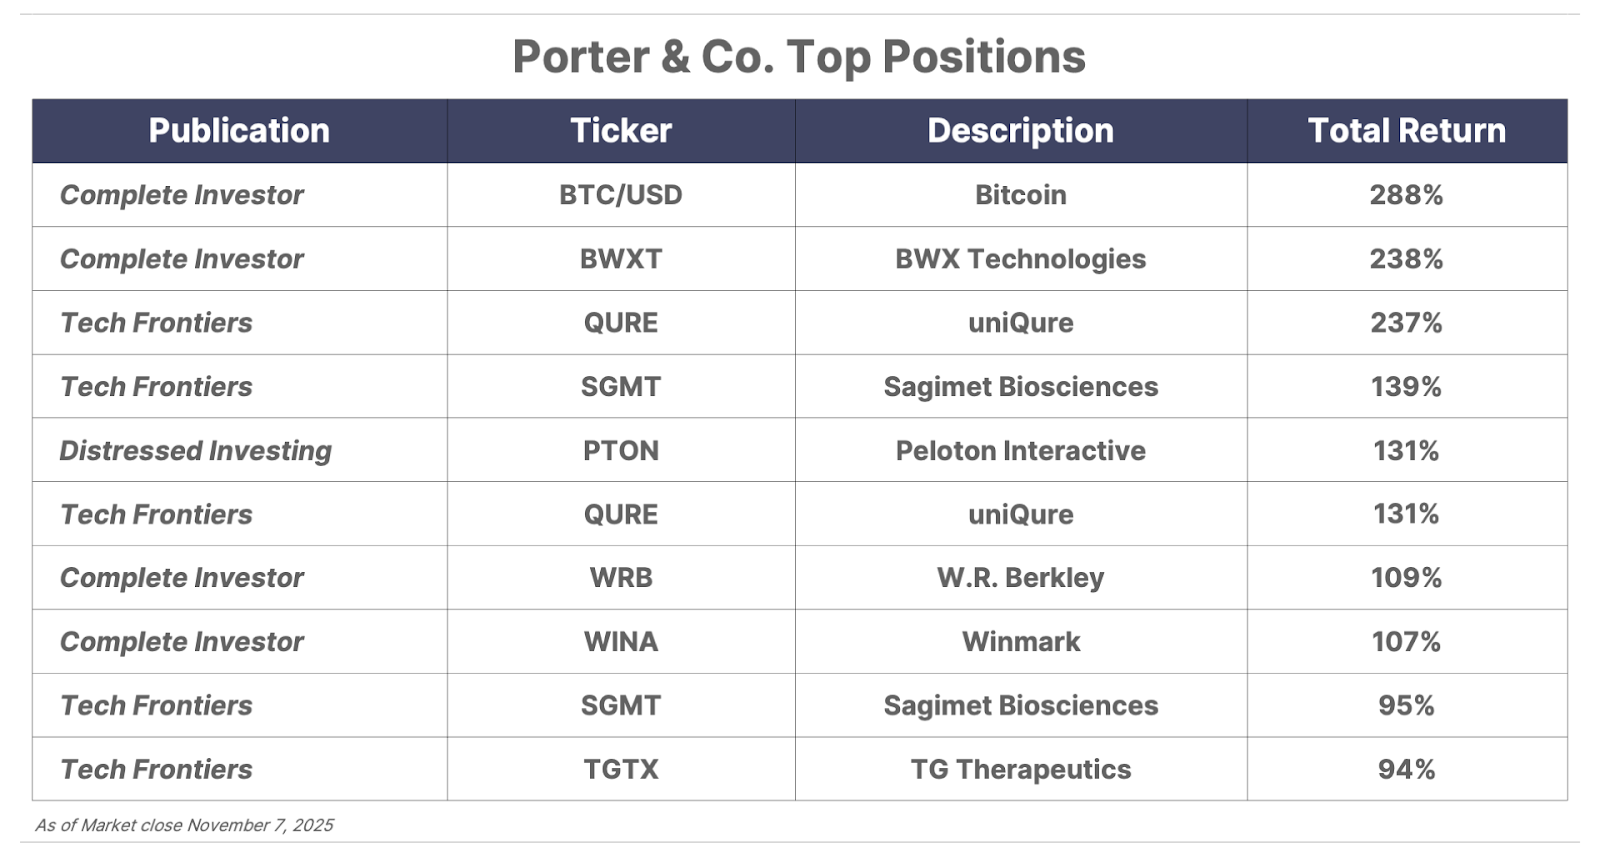
Please note: The investments in our “Porter & Co. Top Positions” should not be considered current recommendations. These positions are the best performers across our publications – and the securities listed may (or may not) be above the current buy-up-to price. To learn more, visit the current portfolio page of the relevant service, here. To gain access or to learn more about our current portfolios, call Lance James, our Director of Customer Care, at 888-610-8895 or internationally at +1 443-815-4447.