Issue #34, Volume #2


This Is A Big Problem For The U.S. Economy
This is Porter’s Daily Journal, a free e-letter from Porter & Co. that provides unfiltered insights on markets, the economy, and life to help readers become better investors. It includes weekday editions and two weekend editions… and is free to all subscribers.
| The top 10% are tightening their belts… Retail sales fell for two consecutive months for the first time in two years… Rising stock prices had made consumers feel wealthier – but… China is buying lots of gold… Porter shares wage-decline data on X… |
On Friday, The Big Secret On Wall Street analyst Ross Hendricks detailed the growing disparity that has emerged between the top 10% of U.S. earners and the bottom 90%. Recent data shows that even the wealthy segment of society is slowing their spending, causing key sectors of the economy to signal trouble ahead… Today, Ross explores what drives much of that wealth-effect spending and what will happen to the U.S. economy if there is a major decline in the stock market.
Until recently, the growth in consumer spending by the top 10% of earners in the U.S. had been enough to offset the economic distress among lower-income households. But in the last several months, it’s become clear that even the top 10% are tightening their belts.
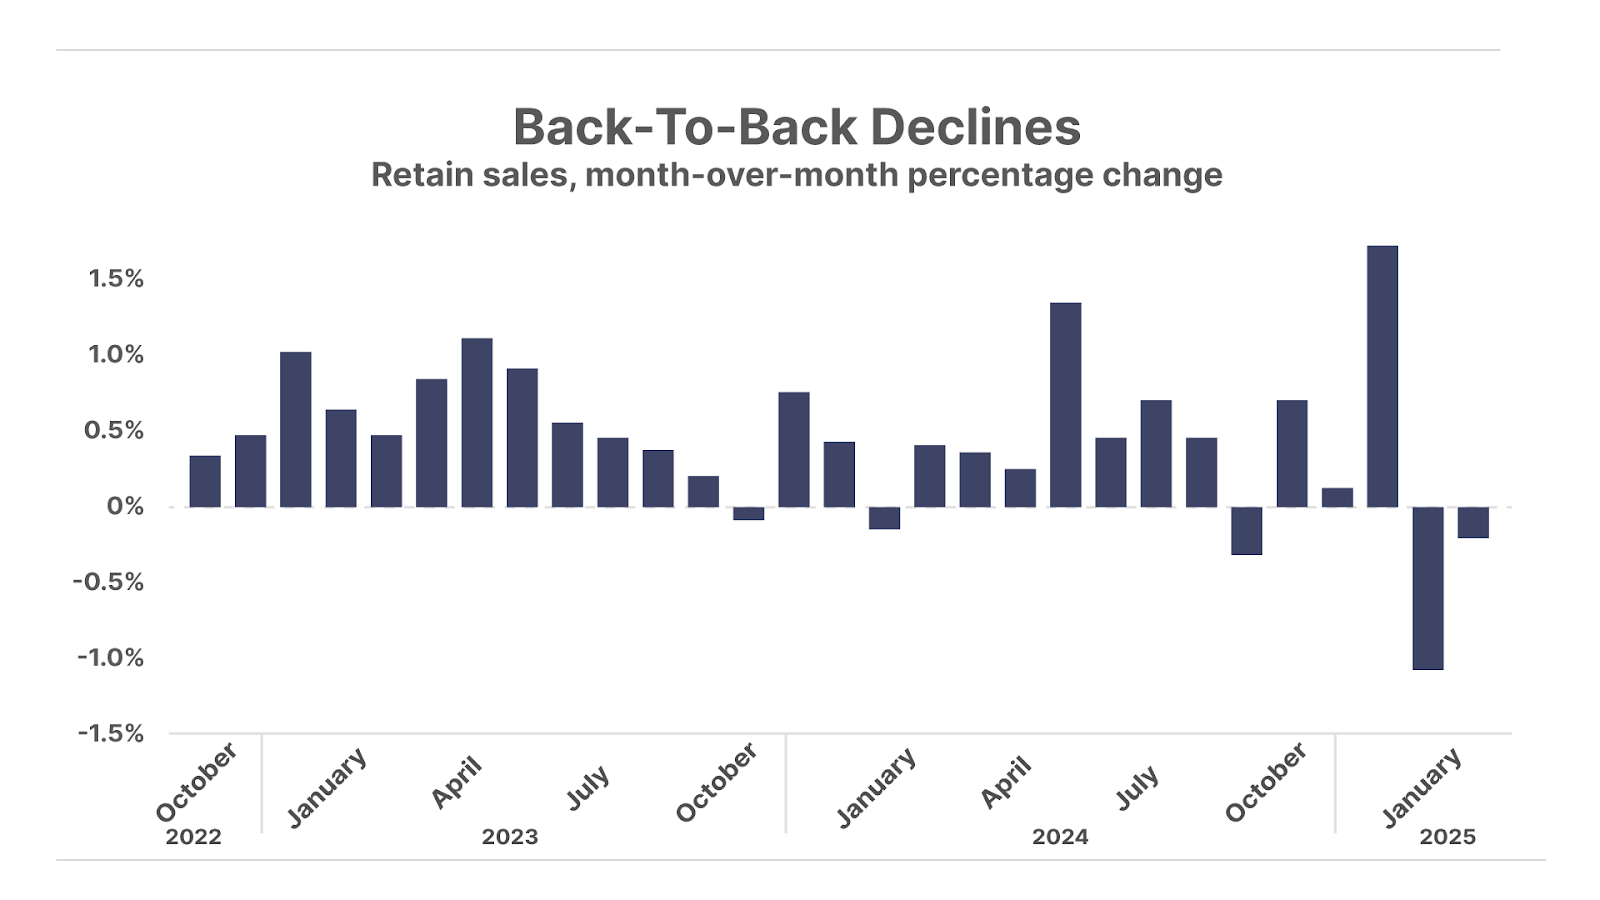
And this spreading consumer distress is now showing up in macroeconomic data. In January, U.S. retail sales fell by 1.2% year on year (“YOY”), marking the largest drop in three and a half years. Dispelling theories of a one-off, cold-weather anomaly driving the January number, February retail sales data came in well below expectations, and posted a consecutive monthly decline – marking the first back-to-back monthly decline in retail sales in over two years:
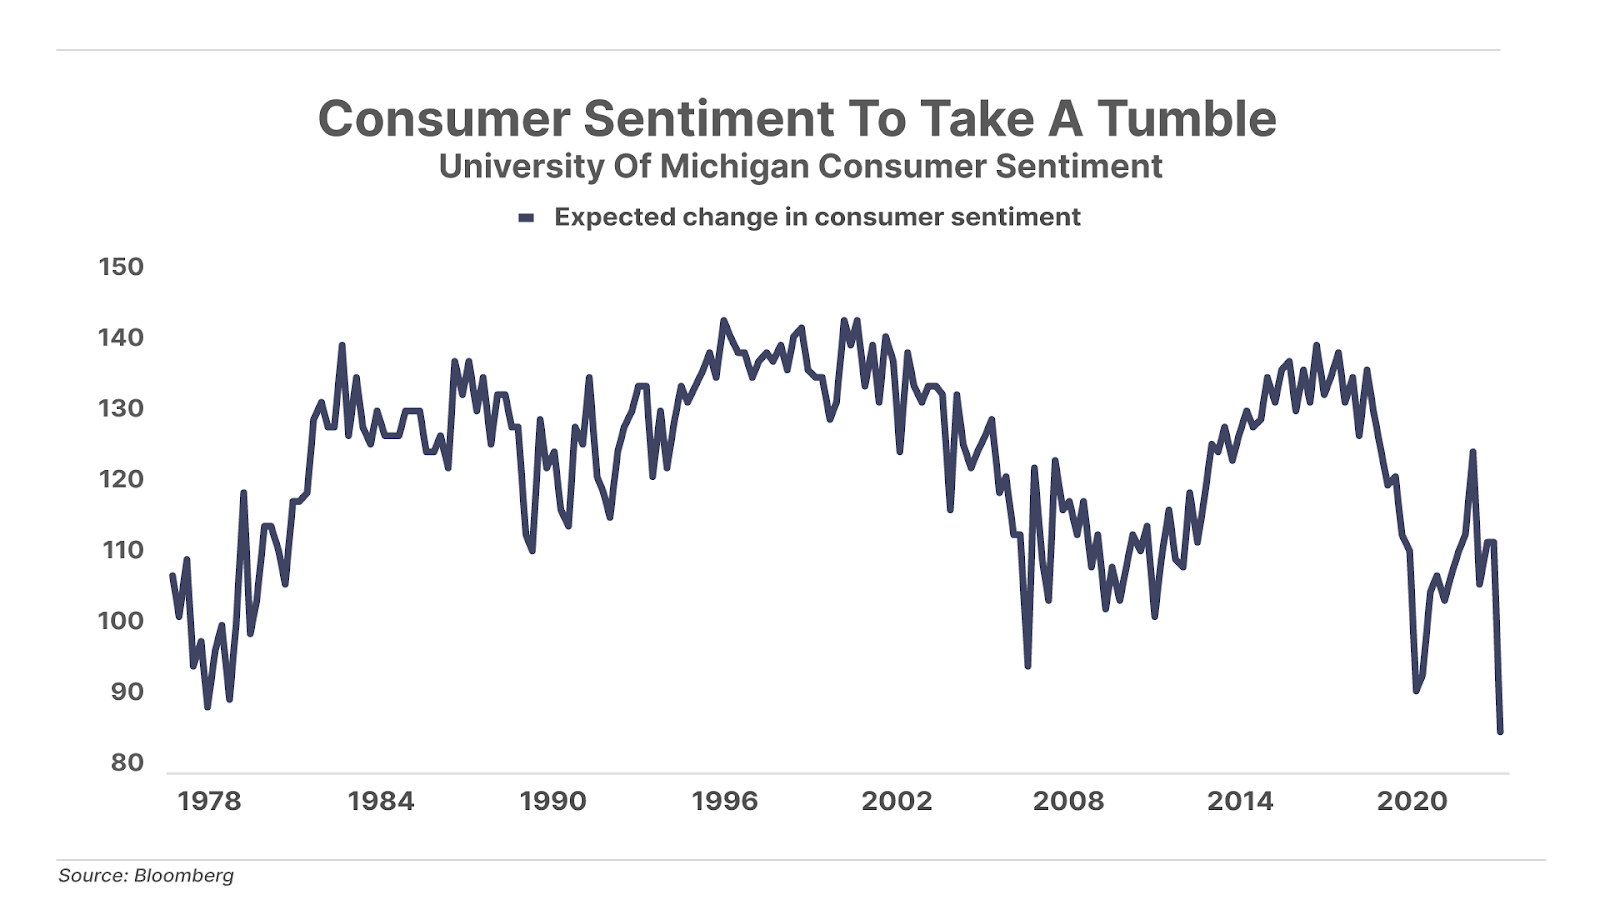
And all signs point toward a further deterioration in consumer spending. The University of Michigan’s Consumer Sentiment Survey showed that the expected change in consumers’ financial situation over the next year fell to the lowest level ever recorded in the 50-year history of the survey:
To make it worse, these weak consumer data points reflected the economic conditions in place before the stock market shed over $5 trillion in value from February 19 to March 13.
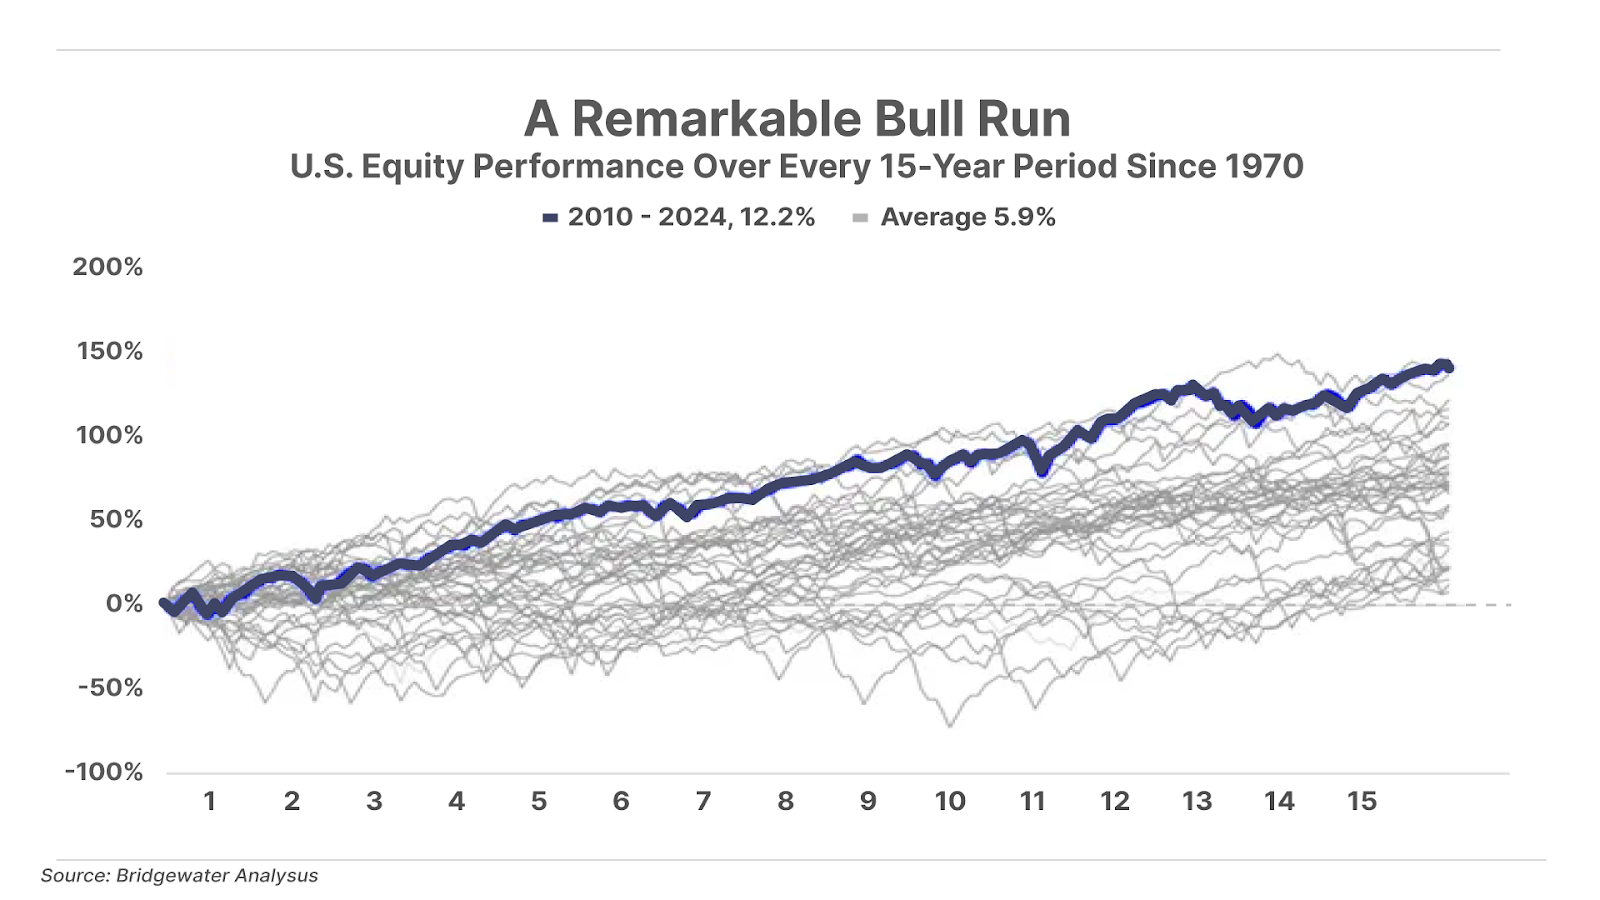
As I mentioned on Friday, the key engine of consumer spending has come from the top 10% of households. And the key factor behind these wealthy consumers’ ability to spend has come from the skyrocketing value of their stock portfolios, courtesy of the greatest bull market in U.S. stocks of the last 50 years:
When consumers see their stock portfolios ballooning in value, they feel wealthier and thus spend more freely than they otherwise would.
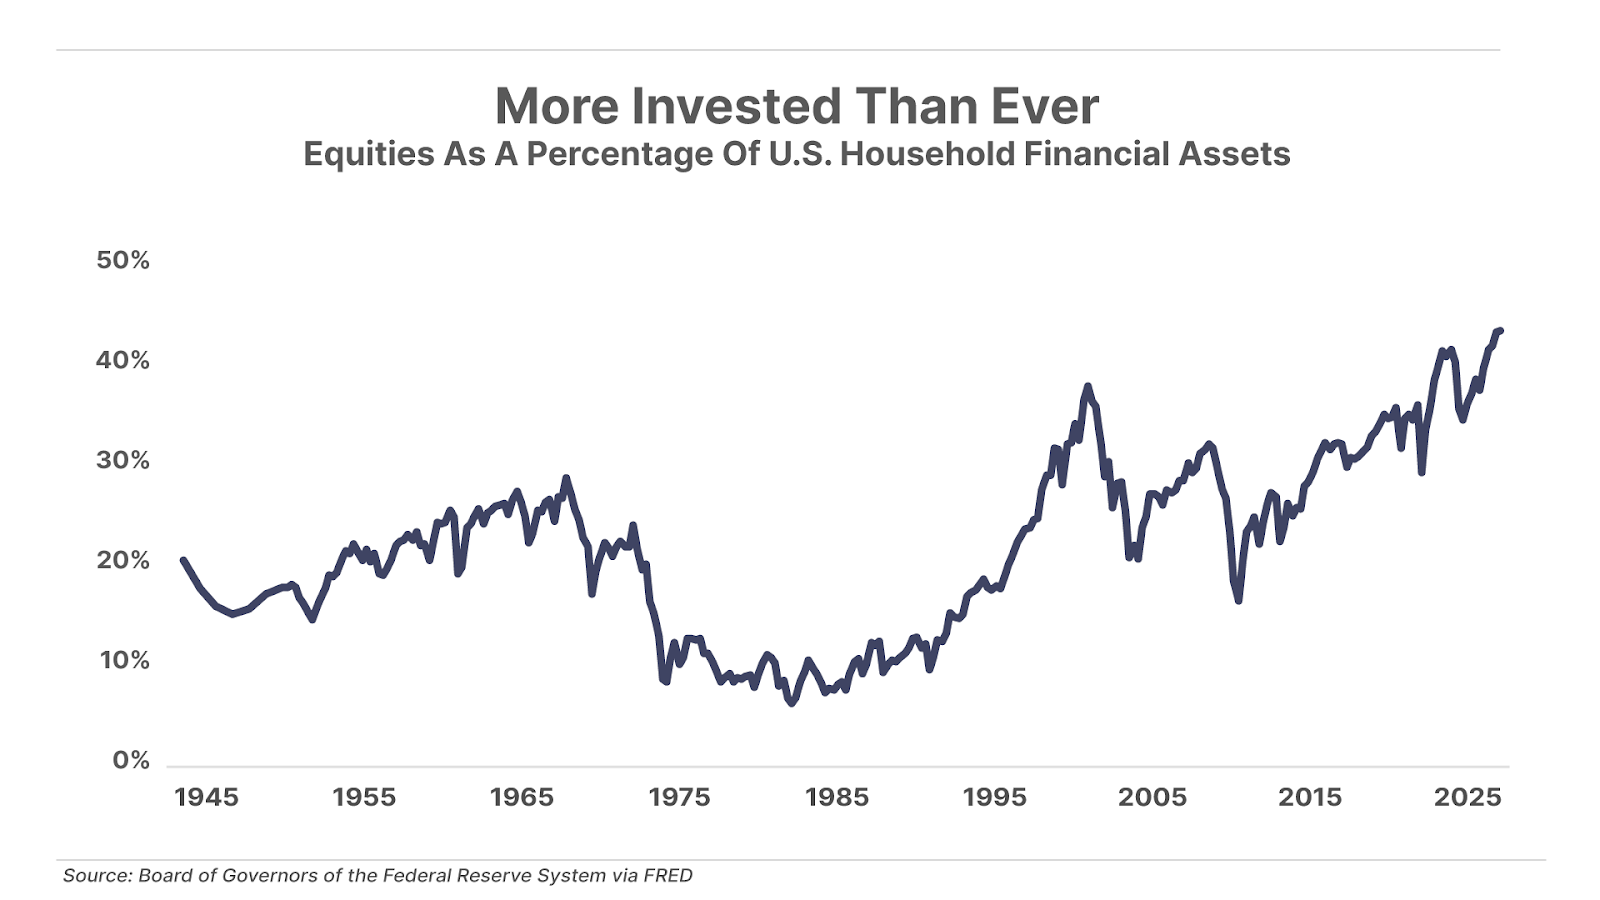
Perhaps the single clearest measure of the importance of this wealth effect in today’s economy can be seen in the following chart, which shows the percentage of household assets invested in the stock market. U.S. households have never had more of their net worth tied up in the stock market in the history of available data, going back more than 70 years:
But when we dig deeper, we discover that – just like the average U.S. investor – the average stock hasn’t fared too well during this bull market. The majority of the gains have accrued to the tiny handful of mega-cap technology firms, known as the Magnificent 7 – Amazon (AMZN), Apple (AAPL), Alphabet (GOOG), Meta (META), Microsoft (MSFT), Nvidia (NVDA), and Tesla (TSLA). Over the last decade, the Mag-7 has appreciated by nearly 800% while the rest of the companies in the S&P 500 have collectively gained a more-pedestrian 150%.
The only time in U.S. history when the stock market was dominated by such a small group of stocks was at the peak of the dot-com bubble in 1999 and early 2000. And, just like back then, the incredible gains in these top-performing companies have increasingly diverged from the average stock as the bull market has aged.
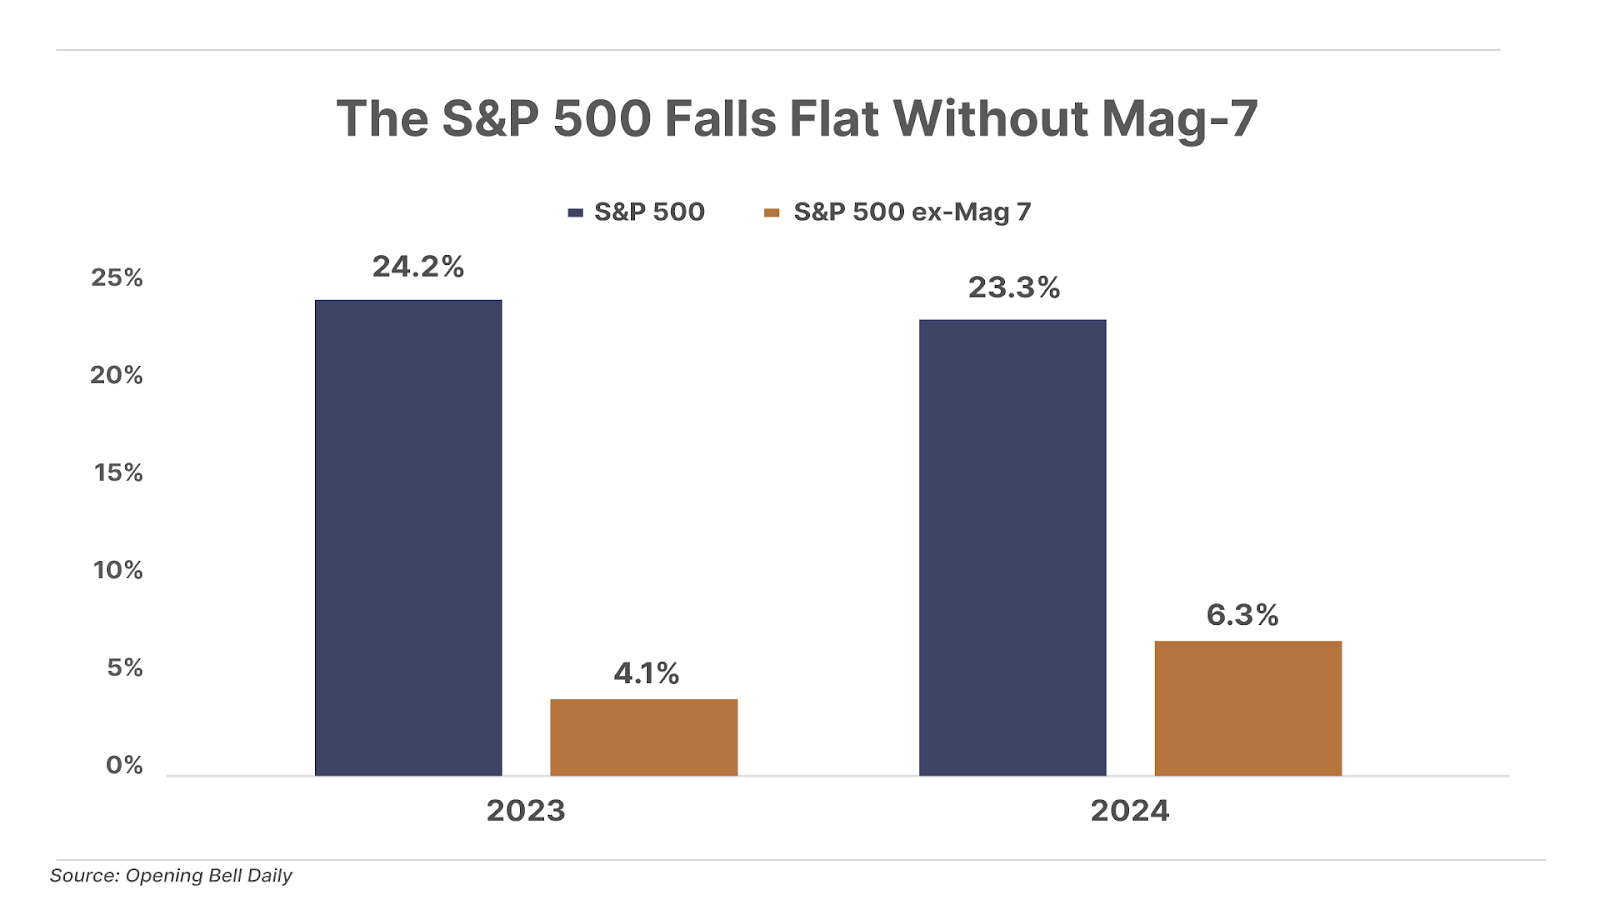
Over the past two years, the S&P 500 has notched back-to-back gains exceeding 20%. But if we strip out the performance of the Mag-7, the index would have returned a paltry 5% on average in each of those years. That’s about on par with the returns of risk-free Treasury bills, and barely keeping pace with inflation:
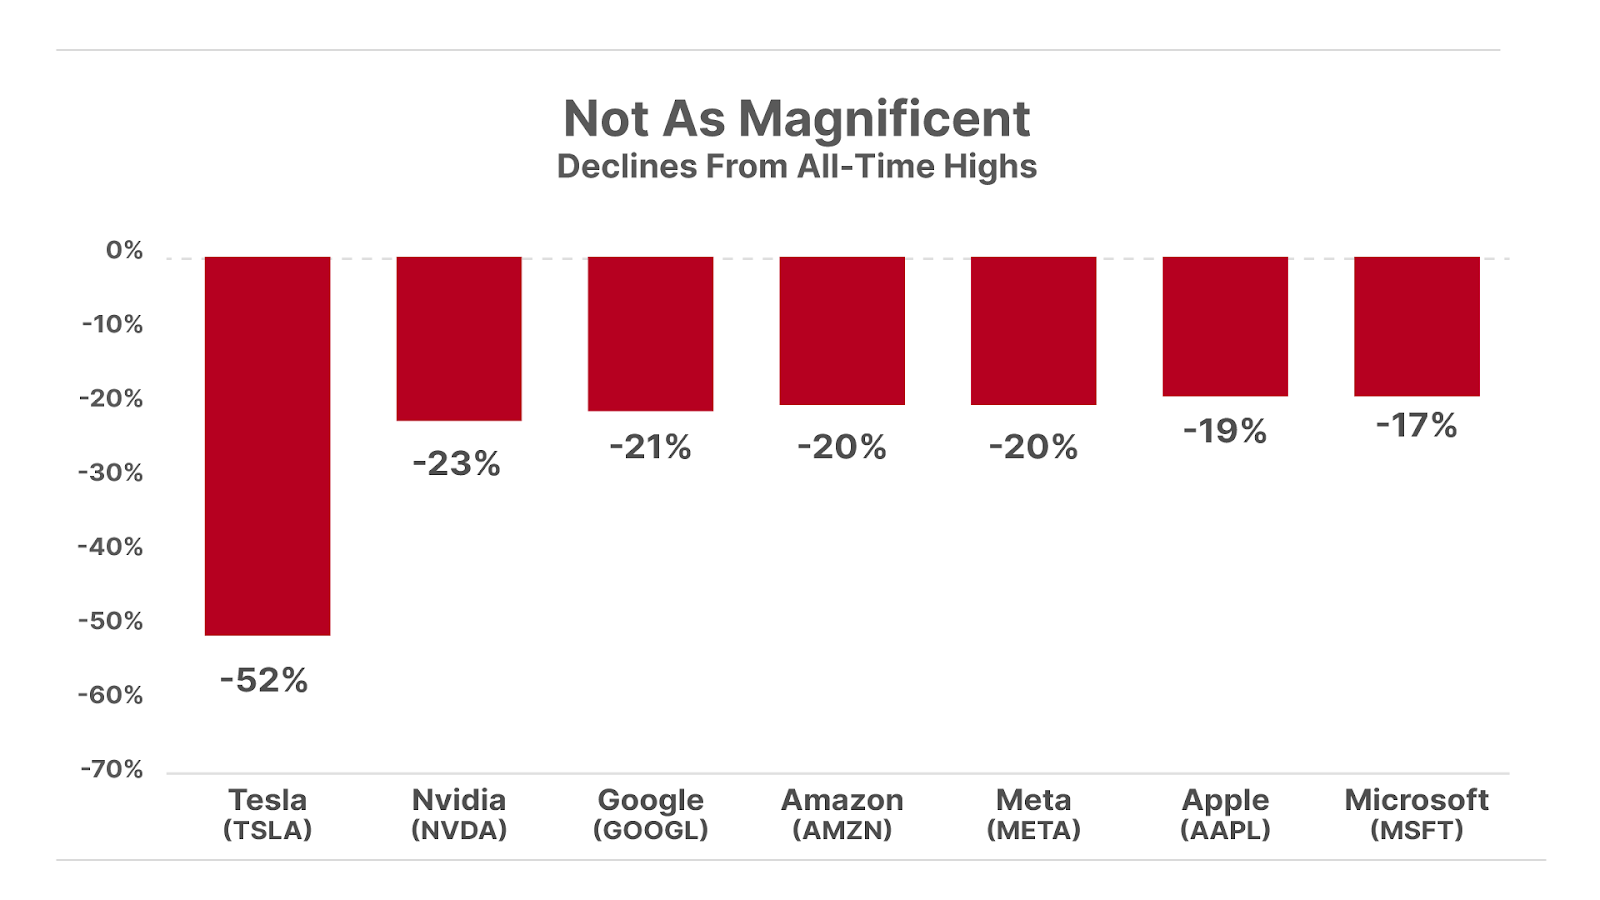
Now, here’s where things become concerning: nearly all of the Mag-7 stocks have either entered a bear market (down 20% or more), or are on the verge of it:
And because the S&P 500 is designed to increase the index weightings of stocks that grow larger in market capitalization, this small group of tech firms has increasingly dominated the index. The Mag-7 now makes up a record 35% weighting in the S&P 500, compared to less than 10% in 2014. The last time such a small portion of stocks dominated the overall market was at the peak of the dot-com bubble, when the top 10 stocks made up a 27% weighting in the S&P 500.
So when their share prices go up, the overall S&P 500 rises with it. But when their share prices go down…
On Wednesday, Ross will dig deeper into what has been fueling the valuations of these seven tech companies… and what happens when the major factor behind Mag-7 gains dissipates.
Three Things To Know Before We Go…
1. Tariff uncertainty continues. With President Donald Trump’s reciprocal tariffs set to take effect on April 2 – what he’s referred to as “Liberation Day in America” – reports over the weekend from Bloomberg and the Wall Street Journal suggest the tariffs may apply to fewer goods than previously anticipated. According to White House officials, tariffs on some industries – including autos and semiconductors – “may or may not happen April 2.” For now, the markets are breathing a sigh of relief, with the S&P 500 trading sharply higher today on the news.
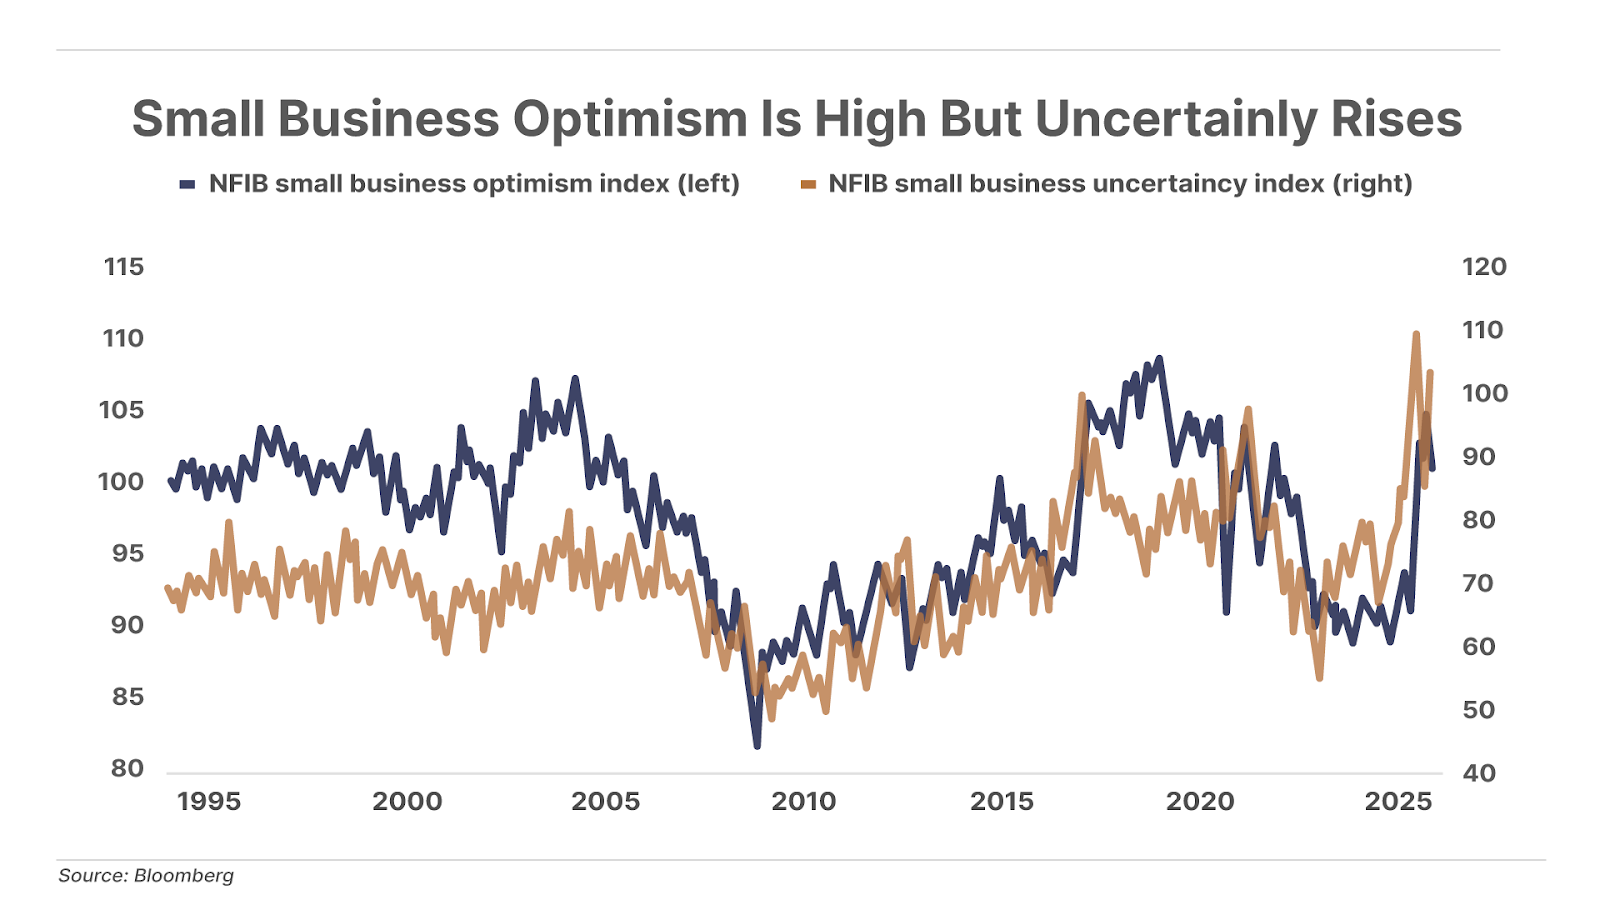
2. Small business optimism remains high… But for how much longer? Small-business optimism remains strong, with expansion plans above the 51-year average for the fourth consecutive month in February. Historically, small-business sentiment serves as an early economic indicator – when the economy begins to deteriorate, businesses cut back on hiring and growth plans. Yet other recent economic data paints a less optimistic picture. More Americans are working multiple jobs than at any point in the last 16 years, and consumer expectations for rising unemployment are at their highest since the Global Financial Crisis. Credit card and auto loan delinquency rates have also surpassed pandemic-era peaks. Despite the warning signs, small businesses remain optimistic, but rising uncertainty signals the potential challenges ahead.
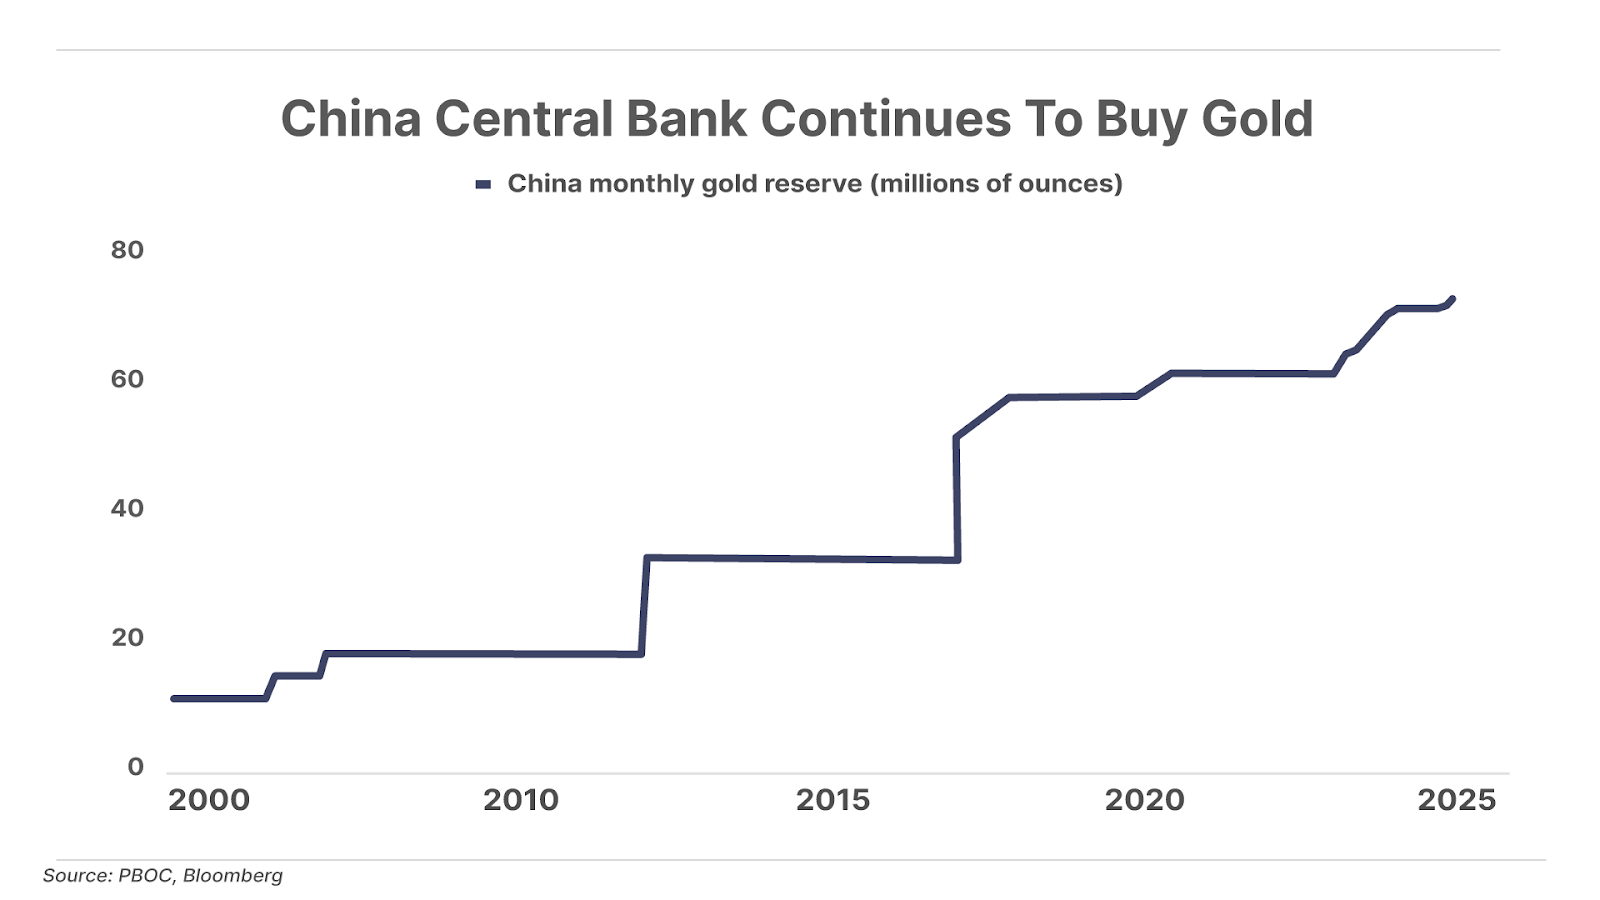
3. China continues to be a big buyer of gold. China’s central bank has been buying gold over the past four months (after a five-month break) and its total reserves hit 2,290 tons at the end of February. But they stand at just slightly over one-quarter of the gold reserves of the U.S. central bank, highlighting the scope for China’s central bank to continue to buy gold… no surprise that the price of gold is up 40% over the past year. (To find out more about where gold is going… click here to see what Marin Katusa, a long-time friend of Porter’s who is also one of the world’s foremost experts on gold, has to say about the best ways to invest in gold now.)
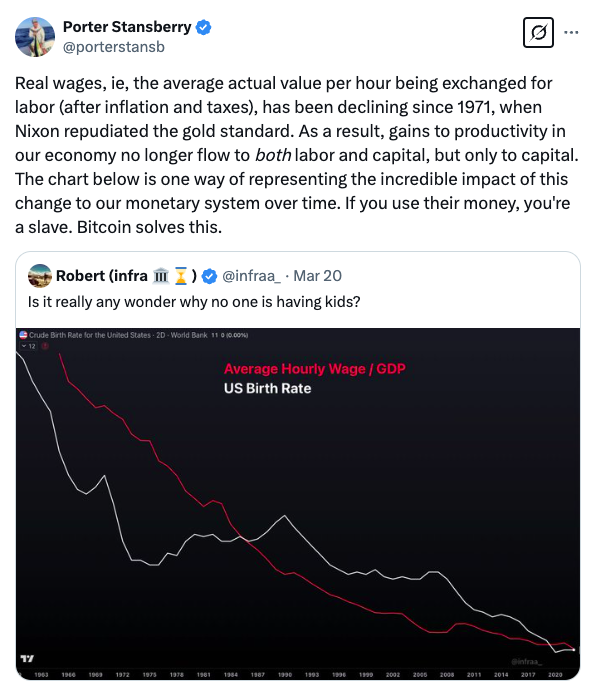
And one more thing… Porter On X
Porter posted this observation below about declining real wages on X yesterday. You can follow him there by clicking here.
Coming Up This Week
Investors will be watching for any commentary that might hint at a more dovish interest-rate stance when six regional Federal Reserve presidents and two governors speak this week.
On Tuesday home-price data is likely to show lower prices, and home-sales data will probably show an increase in February sales over January. We’ll also get consumer-confidence data, forecast to be lower overall.
ADP will publish national employment data on Wednesday, followed on Thursday by the Bureau of Labor Statistics’ initial jobless claims, where forecasts point to a higher number over January. We’ll also get revised GDP data, with forecasts suggesting no change from last month’s advance GDP release.
Friday will see the release of personal income and spending data. Income is forecast to be lower, spending higher. And forecasts for personal consumption expenditures (“PCE”) reports and consumer sentiment data are running flat.
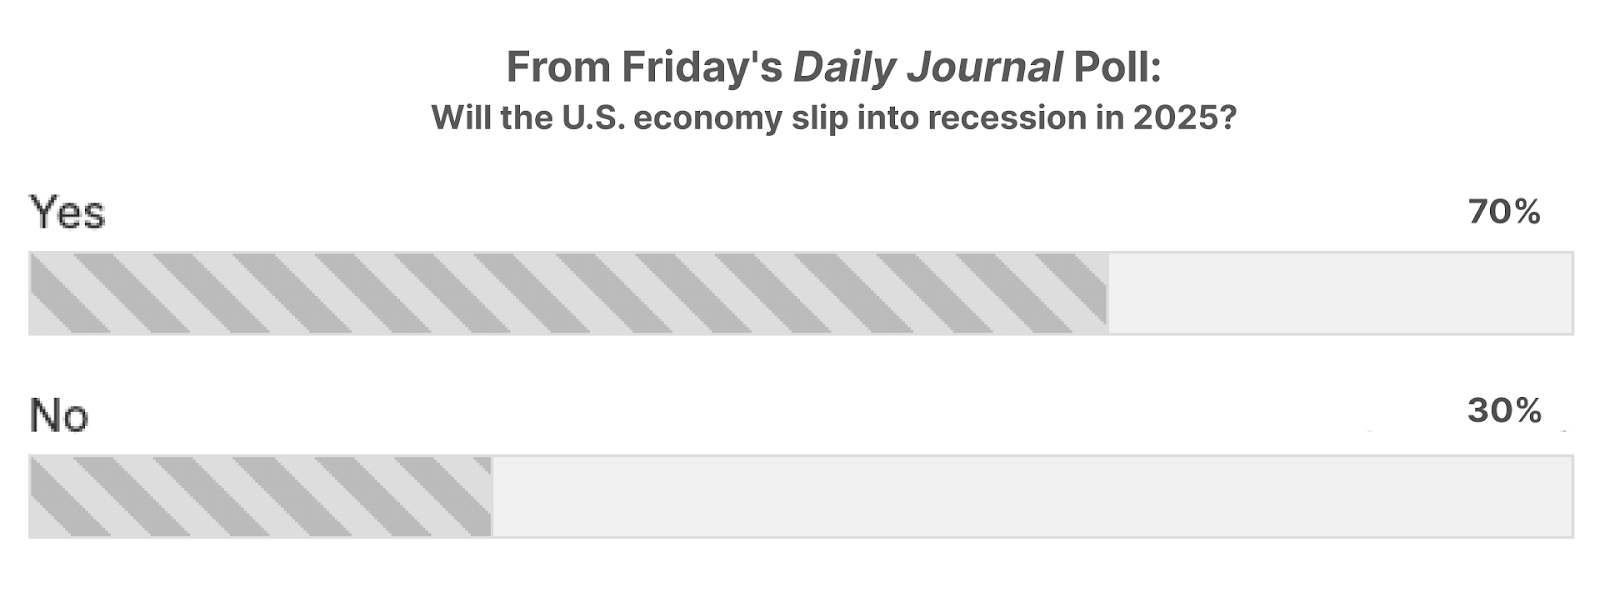
Poll Results… Recession?
On Friday, we asked readers if they thought the U.S. economy would “slip into recession in 2025.” The vast majority of survey takers (70%) said yes, they think the economy will be in recession sometime this year. (By comparison, real-money betting website Kalshi shows that users are assigning a 39% chance of recession in the U.S. by the end of the year – up from a low of a 17% probability of recession, recorded in mid January.)
As always, drop us a line if you agree, disagree, or just want to comment on anything we published or linked to… [email protected]
Ross Hendricks
Houston, Texas
P.S. Stock markets are in the midst of a period of extreme volatility – especially around artificial intelligence (“AI”) stocks. Just seven mega-cap tech companies now account for over a third of the entire S&P 500’s value… and at the center of that, AI is the hottest story in the market – and also the most overhyped.
This kind of concentration creates fragility. And when something goes wrong – even a small stumble – the ripple effects can be huge. In moments like these, you can’t rely on guesswork or emotions. You need a system.
And that means building a regimented process for understanding exactly when to buy any stock, how much to buy… and when to sell it.
Keith Kaplan, the CEO of TradeSmith, has a background in mathematics and computer science – and he’s applied this insight to investing to create a systematized buying, holding, and selling.
His systems measure historical and recent volatility – or risk – in stocks, funds, or cryptocurrencies. And those measurements are focused on the moves these assets make, to tell you…
- When to buy
- How much to buy
- When to sell
- And how much movement you should expect from each asset
To learn more, watch this video that TradeSmith CEO Keith Kaplan put together.
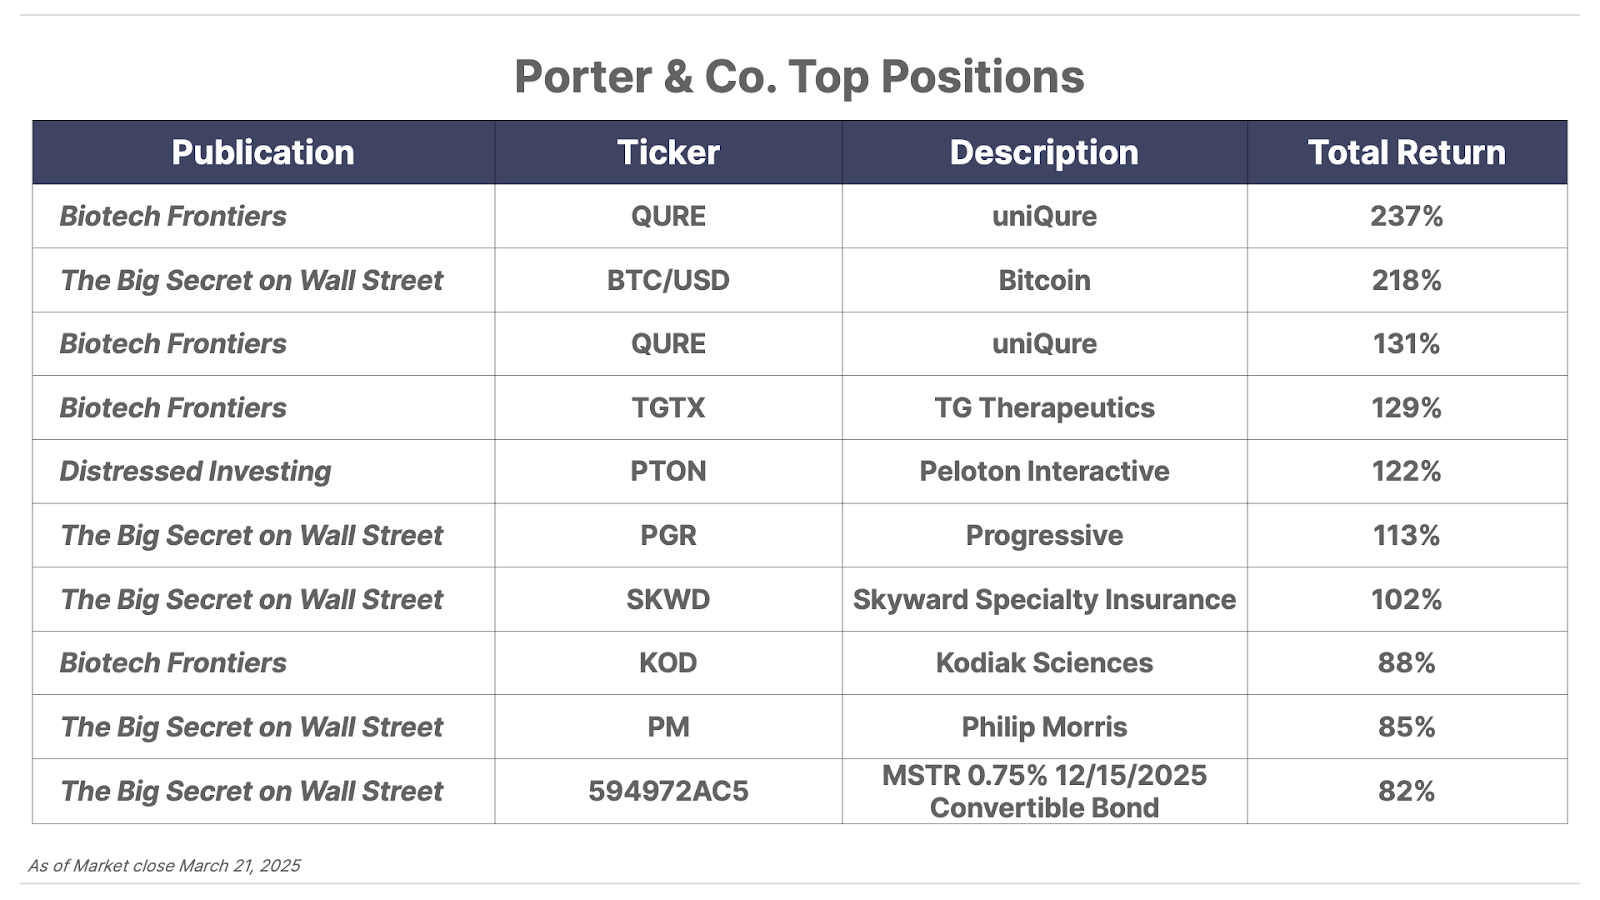
Please note: The investments in our “Porter & Co. Top Positions” should not be considered current recommendations. These positions are the best performers across our publications – and the securities listed may (or may not) be above the current buy-up-to price. To learn more, visit the current portfolio page of the relevant service, here. To gain access or to learn more about our current portfolios, call Lance James, our Director of Customer Care, at 888-610-8895 or internationally at +1 443-815-4447.