
The Yule Cat Is Coming For These 10 Stocks
| This is Porter & Co.’s The Big Secret on Wall Street, which we publish every Thursday at 4 pm ET. Once a month we provide to our paid-up subscribers a full report on a stock recommendation, and also a monthly extensive review of the current portfolio… At the end of this week’s issue, paid-up subscribers can find our “3 Best Buys,” three current portfolio picks that are at an attractive buy price. You can go here to see the full portfolio of The Big Secret. Every week in The Big Secret, we provide analysis for non-paid subscribers. If you’re not yet a subscriber, to access the full paid issue, the portfolio, and all of our Big Secret insights and recommendations, please click here. |
Over the upcoming holidays, we won’t be sending you our regularly scheduled research and insight… instead, we’ll be celebrating the “12 Days of Christmas” from December 23 through January 6 by having members of the Porter & Co. share a favorite (generally investment-related) essay, article, speech, book excerpt, or other text – and their reflections on how it inspired them. Each one will hit your inbox at our usual publication time of 4 pm ET. We hope you enjoy these. We hope you have a wonderful holiday season.
In the meantime, paid-up members can always access their subscriber materials, including our latest recommendations and our “3 Best Buys” for all our different portfolios, by going here.
It’s the most wonderful time of the year… “Naughty List” time at Porter & Co.
In this once-a-year special edition, we make a list of our least-favorite, worst-performing companies, check it twice, and tell you why they’re not so nice. (For better-behaved stocks, see our “Porter & Co. Top Positions” here.)
Last year at this time, we wrote about Krampus, the fearsome Alpine “anti-Santa-Claus” who whips naughty children with a bundle of branches (and has inspired a spate of raucous Christmas festivals where more than a few partygoers were injured).
This year’s Naughty List is chaired by another holiday hoodlum – a giant black feline called the Icelandic Yule Cat (Jólakötturinn). Owned by a big family of trolls called the Yule Lads, who play harmless but annoying pranks during the 12 Days of Christmas, the Yule Cat has darker proclivities. He devours bad children who (drum roll)… don’t wear their fancy new outfits during the holiday season..
The Yule Cat is said to be 12 feet tall – about as tall as a house – to sport knifelike whiskers, and to roam the countryside looking for children who aren’t wearing at least one brand-new piece of clothing. It could be as simple as socks or a hat (hence the Icelandic tradition of gifting Christmas socks)… but whatever it was, you’d better make sure it was on your person on Christmas Eve, when Icelanders exchange presents. (Faced with Iceland’s Arctic winters, a little fear might have encouraged weavers, spinners, and seamstresses to be more productive.)
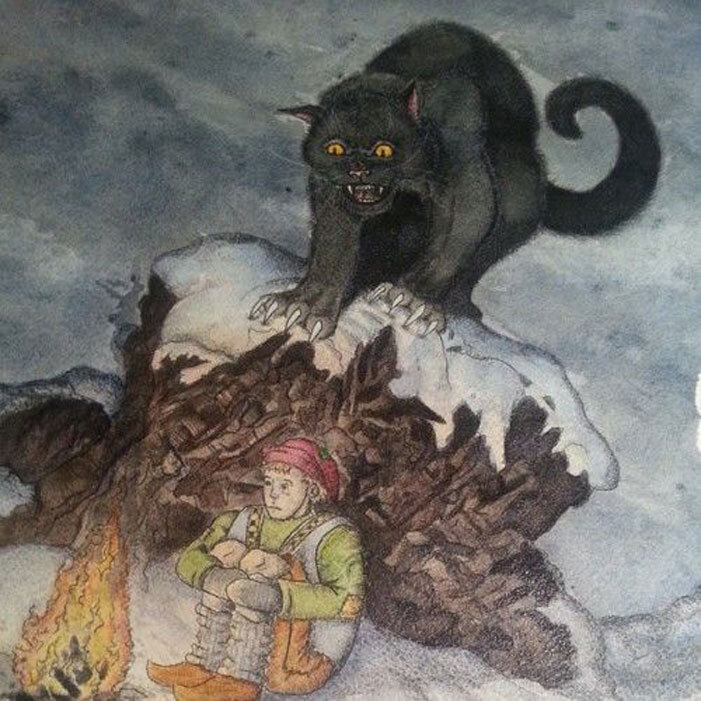
Unlike Krampus, who’s been around since the seventh or eighth century, the Yule Cat is of surprisingly recent vintage – the first known references to Jólakötturinn show up in 1862, in a book of folklore adaptations by Icelandic author and librarian Jón Árnason.
What was Jón adapting, exactly? According to Icelandic scholar Hrefna Sigríður Bjartmarsdóttir, the fashion-policing cat takes his cues from an older European Yuletide tradition, dating to the 16th century, when it became a borderline holiday crime not to wear your spiffiest clothes on Christmas. (Scottish poet William Dunbar, in verses written around 1500, implores his patron King James IV to buy him a new suit for the holiday, or else he’ll be laughed at and called insulting nicknames like “Yowllis yald.”)
The Yule Cat seems to be a uniquely Icelandic twist on this idea. But his claw-hold isn’t limited to the Land of Fire and Ice.
Since the 1930s, when his story was popularized in a book called Christmas Is Coming, his appeal has spread worldwide – netting him his own creepy Christmas carol, performed here by famed Icelandic singer Björk, and lots of tie-in merchandise. (Porter & Co.’s creative director, Russ Cory, owns a Yule Cat sweater, which he plans on wearing to our company Christmas party tomorrow night.)
And according to Bjartmarsdóttir, the Yule Cat can still be found lurking today between department-store racks, urging you to buy pricey presents… or else:
“One source from the Folklore Department of the [Iceland] National Museum is of the opinion that the modern Christmas cat appears in the guise of the salesman and the ready-made needs of the shopping frenzy that now characterizes Christmas and threatens people’s financial well-being. (In this way, it can be said that the Christmas cat is adapting to modern human habits.)”
A cat who gobbles up folks who don’t contribute meaningfully to the economy? He does seem like the perfect mascot for this year’s Naughty List.
It’s Grinch Time (Again)
This time last year, many investors were celebrating a banner year in stocks. But we weren’t feeling so jolly…
We saw a number of worrisome signs for both stocks and the economy, and urged our readers to take some simple precautions to protect themselves, such as holding some extra cash, being selective when making new investments, and avoiding troubled companies like those on our inaugural naughty list.
(Note that we did not – and never will – advise readers to sell all their stocks and move entirely to cash. We continue to believe the surest path to lasting wealth is to hold the highest-quality businesses for the long-term… and when you find a business like that, it is almost always a mistake to sell.)
Today, we find ourselves in a remarkably similar position. You see, while stocks have had another fantastic year – and the economy has held up better than we expected – we’re seeing even more reasons for caution today.
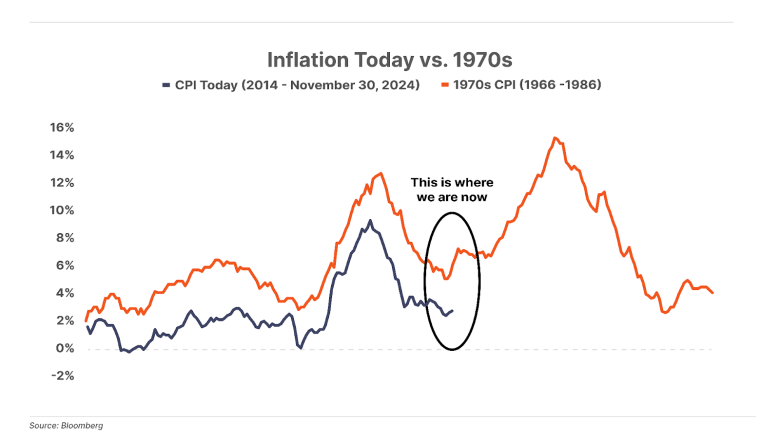
For starters, despite one of the most aggressive rate hike campaigns in history between 2022 and 2024, inflation has been stubbornly “sticky,” remaining above the Federal Reserve’s official 2% target. And now, with the Fed cutting rates again, it’s looking increasingly likely that consumer prices are headed higher (and potentially much higher) again.
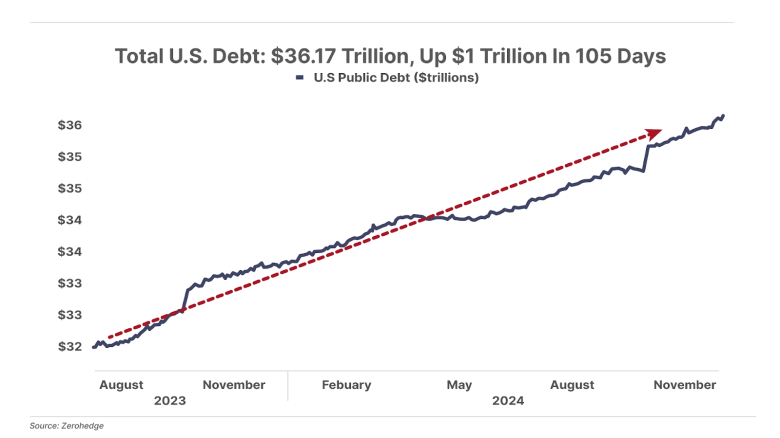
Total U.S. public debt continues to soar, up another $1 trillion in the past three months to more than $36 trillion today.
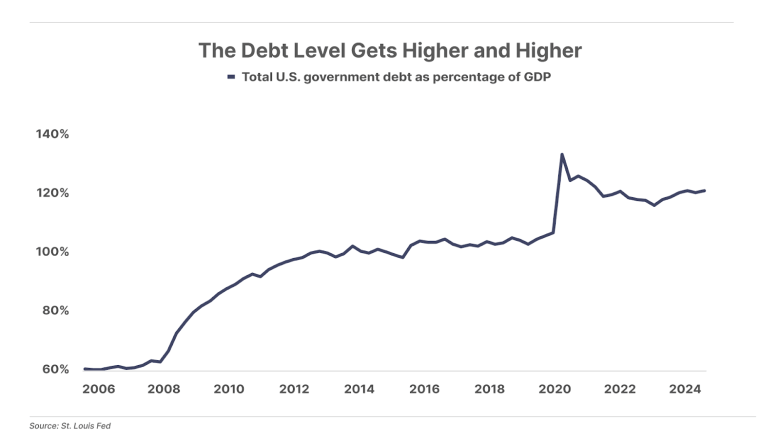
As a result, debt as a percentage of gross domestic product (“GDP”) has risen to 121% – the highest level in U.S. history (excepting the statistical blip of the COVID-19 shutdown) – up from roughly 60% in 2008. And an incredible 28% of the government’s $5 trillion in annual tax “revenue” now goes toward paying just the interest on this debt.
Continuing jobless claims, which represent the number of unemployed people who qualify for benefits under unemployment insurance, have hit a three-year high. To make matters worse, new job postings have been falling for three consecutive years, making it harder for those who need a job to find one. 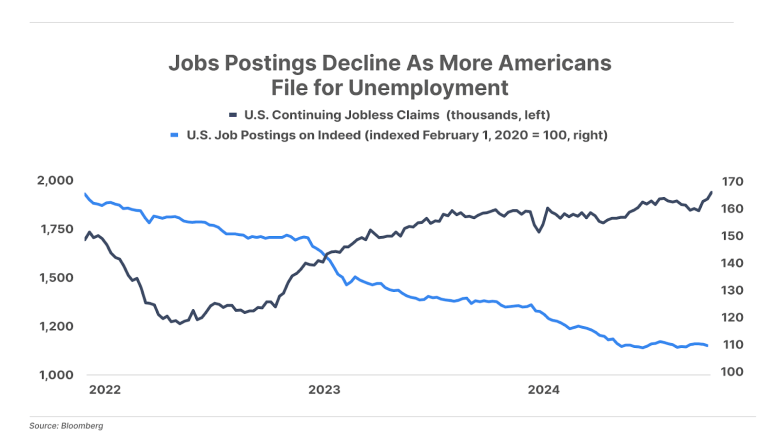
Not surprisingly, long-term unemployment is surging, up 42% this year alone.

U.S. manufacturing has experienced its longest contraction since the 2008 Global Financial Crisis, declining 25 out of the last 26 months. And leading economic indicators are screaming recession…
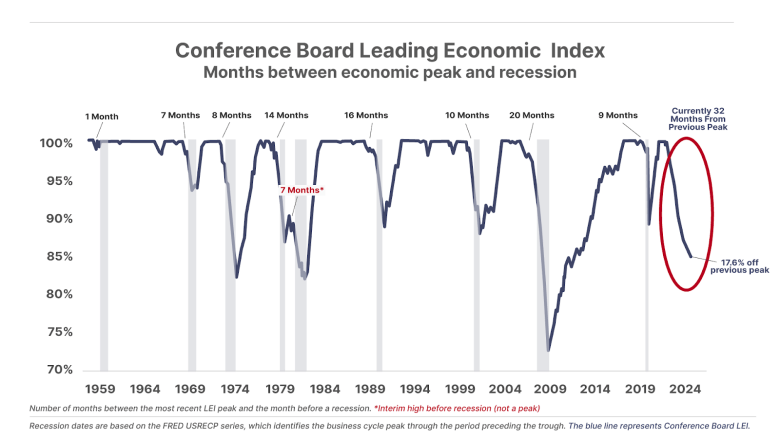
The Conference Board’s Leading Economic Index (“LEI”) fell to its lowest level since March 2016. The LEI gathers various pieces of consumer and business data to provide an early read on where economic activity is headed. On average, a recession starts roughly 11 months after the peak in the LEI. Today the LEI is 17.6% below its latest peak, while the index has not increased in 32 consecutive months – the longest streak on record without a recession.
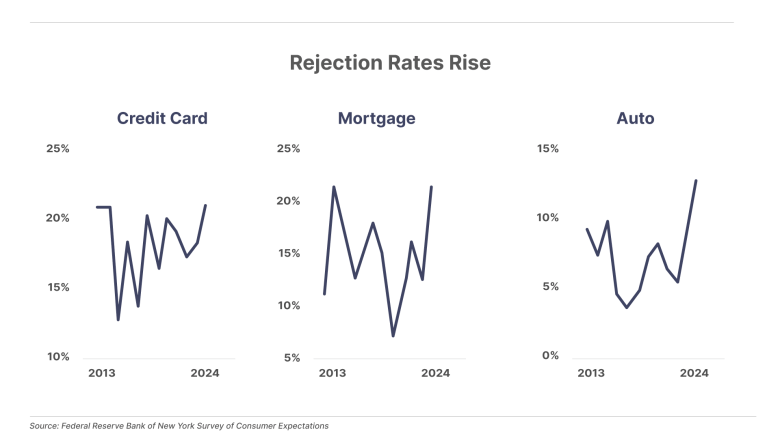
We’re also seeing continued warning signs in consumer spending, with applications for credit cards, mortgages,and auto loans now being turned down at the highest rates in over a decade…
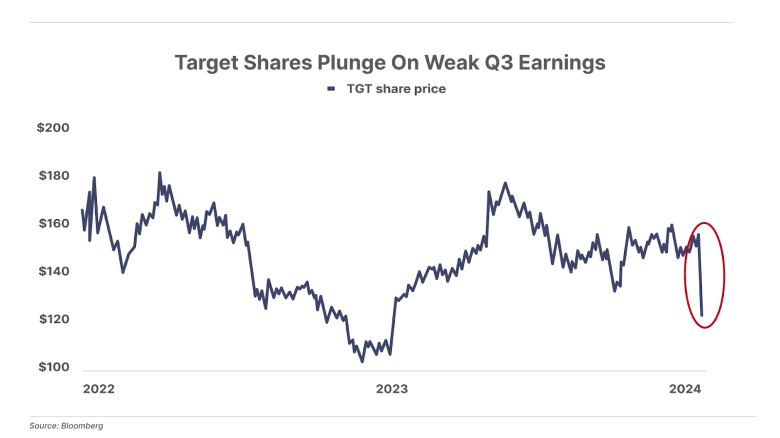
And clear weakness in a number of bellwether consumer brands this year, including McDonald’s (MCD), Starbucks (SBUX), PepsiCo (PEP), Procter & Gamble (PG), and most recently, Target (TGT), whose shares plunged 20% last month after it released dismal third-quarter earnings and slashed its full-year profit outlook.
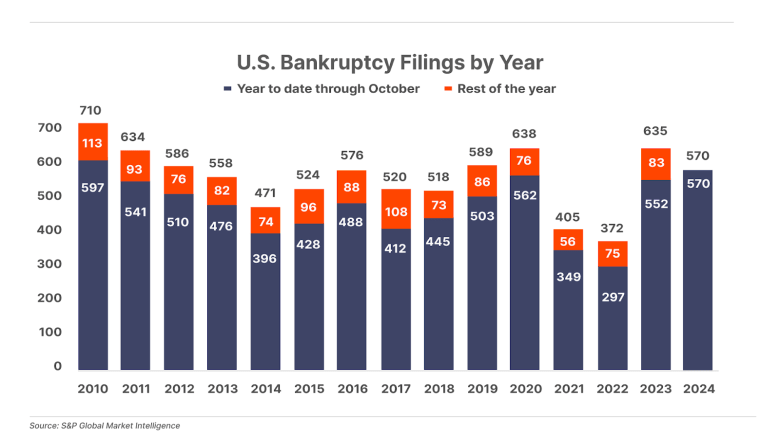
There are also signs of trouble in corporate credit, where companies are filing for bankruptcy at the highest rate since 2010.
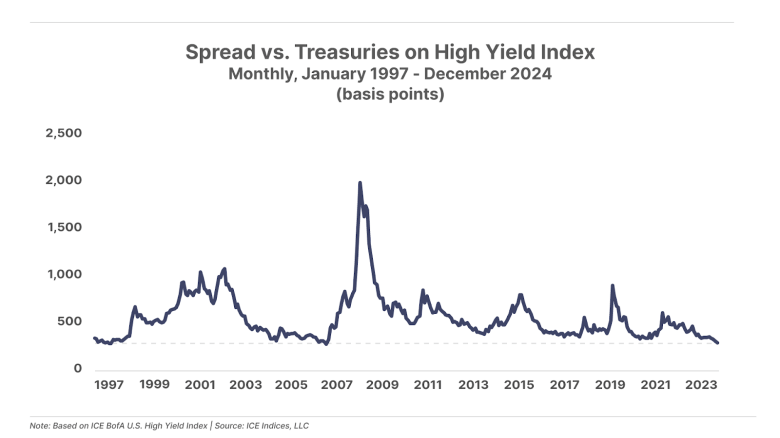
Yet, despite the rising number of bankruptcies – reflecting companies’ difficulties with paying their debt – spreads on high-yield bonds versus U.S.Treasuries continue to fall. The last time the high-yield spread was this low – indicating extreme optimism on the part of investors – was right before the Global Financial Crisis.
Meanwhile, equity valuations have continued to rise.
The S&P 500’s cyclically-adjusted adjusted price-to-earnings (“CAPE”) ratio – which smooths earnings volatility by taking a 10-year average rather than the single-year earnings snapshot of the standard P/E ratio – recently crossed 38 for only the third time in history. It’s now higher than any time outside of the peak of the dot-com bubble.

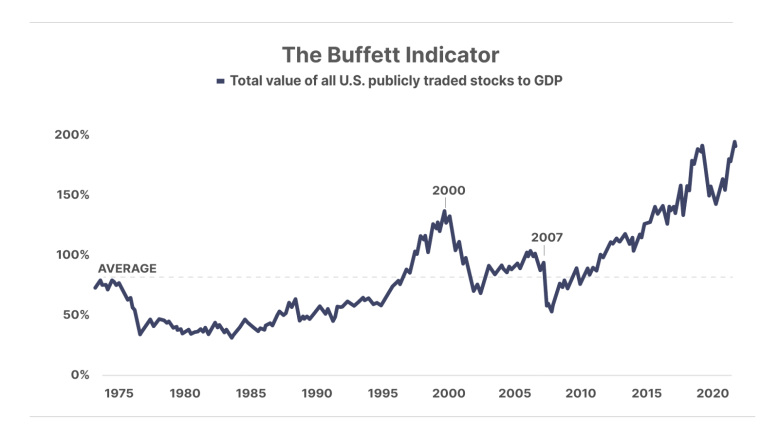
Warren Buffett’s favorite measure of value – total market capitalization relative to GDP – is already at a record high. It is currently almost double its prior extreme at the peak of the dot-com bubble.
Market concentration has also never been so extreme. The mega-cap tech stocks known as the Magnificent 7 – Microsoft (MSFT), Meta (META), Apple (AAPL), Amazon (AMZN), Nvidia (NVDA), Alphabet (GOOG), and Tesla (TSLA) – now make up a record 34% of the S&P 500’s total market capitalization. 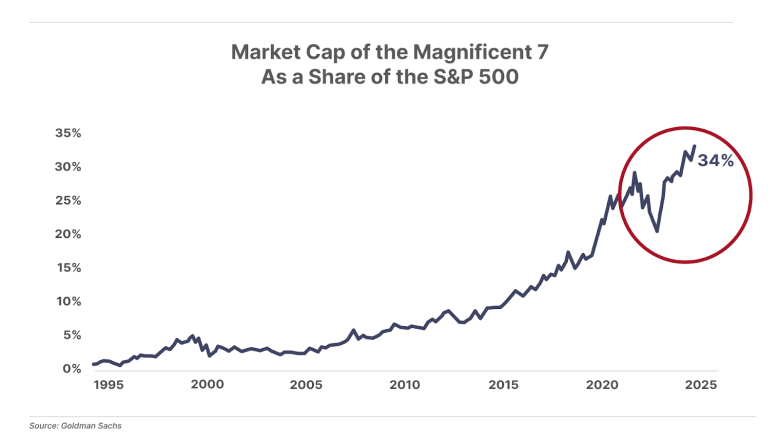
Despite these rising risks to stocks and the economy, retail “mom and pop” investors are even more bullish than they were this time last year.
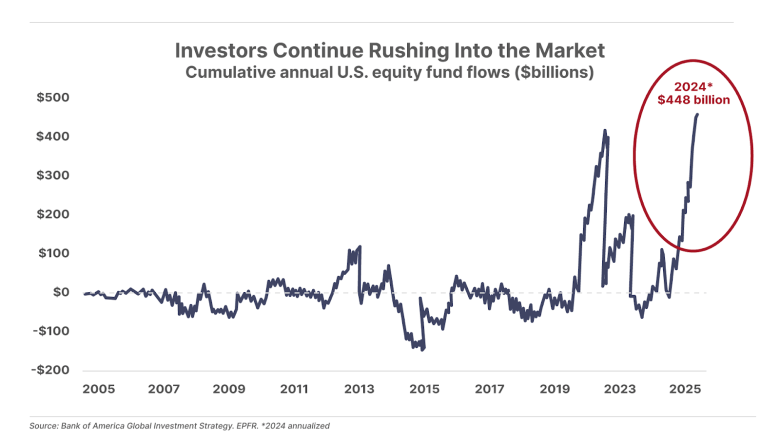
Cumulative U.S. equity inflows are on pace to reach an all-time high of $448 billion this year. This is nearly $50 billion more than the prior record of $400 billion set in 2021, and nearly double the inflows of 2022 and 2023 combined.
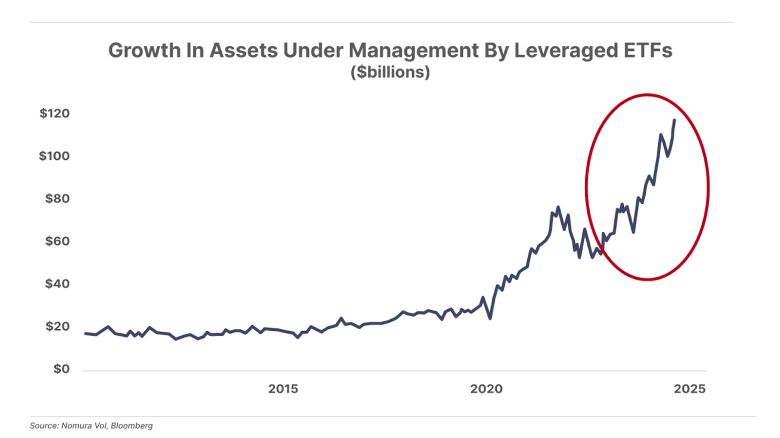
Investors are especially fond of the most speculative corners of the market, pouring a record amount of money into leveraged exchange traded funds (“ETFs”) (see below) and gambling billions on crypto meme coins.
And more Americans than ever expect the party to continue in 2025. Recent data from the Conference Board, an independent business research group, showed 51.4% of U.S. consumers expect stocks to rise next year – the highest percentage on record – versus 37.4% this time last year.

However, while retail investors have been piling into stocks, the “smart” money has been selling like there’s no tomorrow.
Corporate insiders – senior executives who hold shares of their publicly traded companies and know more than anyone else about the condition of their employer – have been selling shares at a record pace.

Warren Buffett – one of the most successful investors of all time – has also been selling. His firm Berkshire Hathaway has nearly doubled its cash balance since the start of the year, and now holds a record-high 28% of its total assets in cash and cash equivalents.

Given these risks, we continue to urge extreme caution in today’s market.
Again, that doesn’t mean we recommend selling everything in your portfolio and stuffing the cash under your mattress. Rather, it means holding a healthy cash position… continuing to be highly selective when considering new investment positions… and avoiding risky, speculative assets.
In that spirit, we present our updated 2024 “Naughty List.”
These “Naughties” Are In Trouble No Matter What Happens Next

To identify the stocks on this list, we started with the Russell 3000 – a broad index of roughly 3,000 stocks representing 98% of the investable U.S. market by capitalization, including all large-cap, mid-cap, and small-cap U.S. stocks, along with some microcaps.
We then filtered for those that owe significant money to creditors (i.e., that have a relatively large amount of total debt outstanding) and that are required to make regular annual payments on that debt to avoid default.
Finally, we screened for those companies with the largest negative free cash flows (cumulated FCF) over the past three years. This is a short enough time period to be current, but long enough to ensure we don’t flag healthy companies suffering a temporary hiccup.
Like last year, the individual circumstances of these companies vary widely. However, they all have two critical problems in common…
They have significant debt burdens, and they don’t generate enough cash (over and above operating costs) to cover even the interest on those debts today. This combination represents a potentially existential threat in any scenario, let alone a severe economic downturn.
However, it’s important to note that these companies are already struggling – despite their still-historically-low financing costs – before going into a recession.
That’s unlikely to change even if the economy continues to avoid a hard landing in the year ahead. And importantly, because many of these companies financed their current debt at the record-low interest rates of the past decade, these problems are likely to worsen as these debts come due at today’s higher rates, even if borrowing costs move lower from where they are now.
In other words, many of these stocks could be a “zero” – meaning equity investors are likely to be wiped out through default or reorganization – regardless of what comes next.
We urge investors who own any of these “naughties” to consider selling them soon. And though we at Porter & Co. rarely recommend shorting stocks, several of the names on this list could be strong candidates for investors looking to hedge. (In fact, Boeing is currently an open short position in the Big Secret on Wall Street portfolio.)
Of course, as we noted last year, recessions and major downturns in stock prices are also what every long-term investor should hope to see. These are made-to-order opportunities to buy the very best businesses at substantial discounts… and our paid-up Big Secret subscribers can count on us to tell them exactly when these opportunities arrive. If you are not a current subscriber, and you’d like to join them, click here to learn more.
And now, on to the festivities…
As we mentioned earlier, we’ll be sharing a special Porter & Co. 12 Days of Christmas series starting Monday, December 23. We’ll be back to our regular programming on January 6.
We wish you a Merry Christmas, a Happy New Year, and no visits from Jólakötturinn.
Porter & Co.
Stevenson, MD
This content is only available for paid members.
If you are interested in joining Porter & Co. either click the button below now or call our Customer Care team at 888-610-8895.