Dear friends –
For more than 20 years, I wrote to the subscribers of Stansberry Research almost every day, and always on Fridays.
Doing so was difficult – but the discipline of writing about the markets every day taught me a lot about investing and about my subscribers. I’m ready to do the same now at Porter & Co.
So, we’re launching a new publication, Porter’s Daily Journal, where I’ll be writing to you personally on Monday, Wednesday, and (of course) Friday.
And we’re rejiggering our publishing schedule – moving our paid newsletters to Thursday and moving our “Spotlight” to Tuesday, so that you’ll begin receiving something from us each weekday. We’ll continue to send you our content at the same time each day (4 pm ET) so that you’ll always know when to find it in your inbox. And, of course, we’ll maintain an archive on our website (porterandcompanyresearch.com) if you ever want to reference a particular issue.
Before we begin, just a brief note about how happy I am to resume writing daily e-letters to you all again. I started doing so almost 30 years ago (!) when I was a 26 year old launching his first business. I’ll turn 52 later this year – I’m not a kid anymore.
So much has changed in my life and in the markets since I wrote my first Friday Digest to our subscribers. I’ve seen more highs and lows than anyone would have believed possible. I’ve made hundreds of millions as an investor and a businessman since then. But I lost a marriage and a family in the process, mostly because of the relentless pursuit of having my business succeed. And then, in a sequence of events that seem like a movie plot, I lost control of that business too.
These experiences – and the thousands of companies I’ve analyzed, the hundreds of business and political leaders I’ve met, and the brilliant group of thinkers and writers I’ve always surrounded myself with – have created a “patina” of wisdom and humility that I didn’t have before. That’s the thing about life: “too soon old; too late wise.”
I’m hoping to share all of that with you, my dear paid-up subscribers. (By the way, the phrase “paid-up subscribers” is a hat tip to one of my greatest mentors, the legendary financial writer Jim Grant. Jim, I hope you smile every time you see me using your famous phrase.)
There’s a lot I can teach you about investing and about life. I’ve produced market-beating portfolios for decades. I have an unmatched network of friends across the financial markets. I’ve traveled to almost every major city in the world – and many of the smaller ones too. But… there’s a catch: to learn, you’ll have to read carefully and think about what I write. The most valuable things will be counterintuitive and will challenge your preconceived notions. That’s how learning works, as you probably already know.
Best of all? My Journal is completely free for all of our customers.
Whether you’ve bought a full subscription ($1,425) to my weekly investment newsletter The Big Secret on Wall Street, or whether you’ve only “tested the waters” with one of our compilation reports ($199) on specific market sectors, I’d like to write to you every day the markets are open. I’ll do my best to show you something important that you won’t find anywhere else.
And… Porter’s Daily Journal will also feature… a mailbag.
Longtime readers will remember my banter with subscribers in the Stansberry Research Digest. So, when you think I’ve gotten it wrong, please tell me all about it! Write to me at [email protected].
Porter’s Daily Journal
Issue #1, Volume #1
September 9, 2024
What Wall Street Hopes You Never Find Out: Most Stocks Lose Money
Three Things You Need To Know Now:
- This Is A Big Week For Data: August consumer price index (“CPI”) on Wednesday; August producer price index (“PPI”) on Thursday; and… most importantly: Initial jobless claims on Thursday.
- The Market Is Not Ready For Much Weaker Jobs Data. Full-time employment fell by 1 million workers in August, marking the seventh (!) monthly decline. The job market cooling off (and unemployment rising) is the key signal that a recession is coming.
- Yield Curve Inversion Is Over. The yield curve has been inverted for longer than any other time in history, other than 1929. With unemployment rising, the yield curve is going to steepen and we are going to enter a recession. (Here’s a good video that explains why.)
And also…
I believe the coming recession is going to be far worse than anyone expects, mostly because of “mandatory” U.S. government transfer payments (like Social Security, unemployment, and other social programs). This year’s budget deficit is currently $1.6 trillion, which is 5.5% (!) of GDP, a level that’s unprecedented in U.S. history during economic expansions. With two-thirds of U.S. federal spending now “mandatory” transfer payments (equal to 15% of GDP!), we are well along the “Road to Serfdom” and becoming a socialist country.
The unbelievable size of U.S. deficits and debt have created a legitimate threat to U.S. dollar hegemony. The “End of America” has been happening for more than a decade as more and more central banks turn to Bitcoin, gold, and now the new BRICS (Brazil, Russia, India, China, South Africa) currency. These factors will make it much harder for the Fed to prevent a recession in the U.S. The fiscal reality for America is bleak, and politically we are less prepared than ever to reach the kind of consensus we’ll need in order to avoid a massive financial crisis and the loss of our reserve currency status. If you’re planning to use the dollar to buy foreign assets, now is the time.
What’s this mean for stocks?
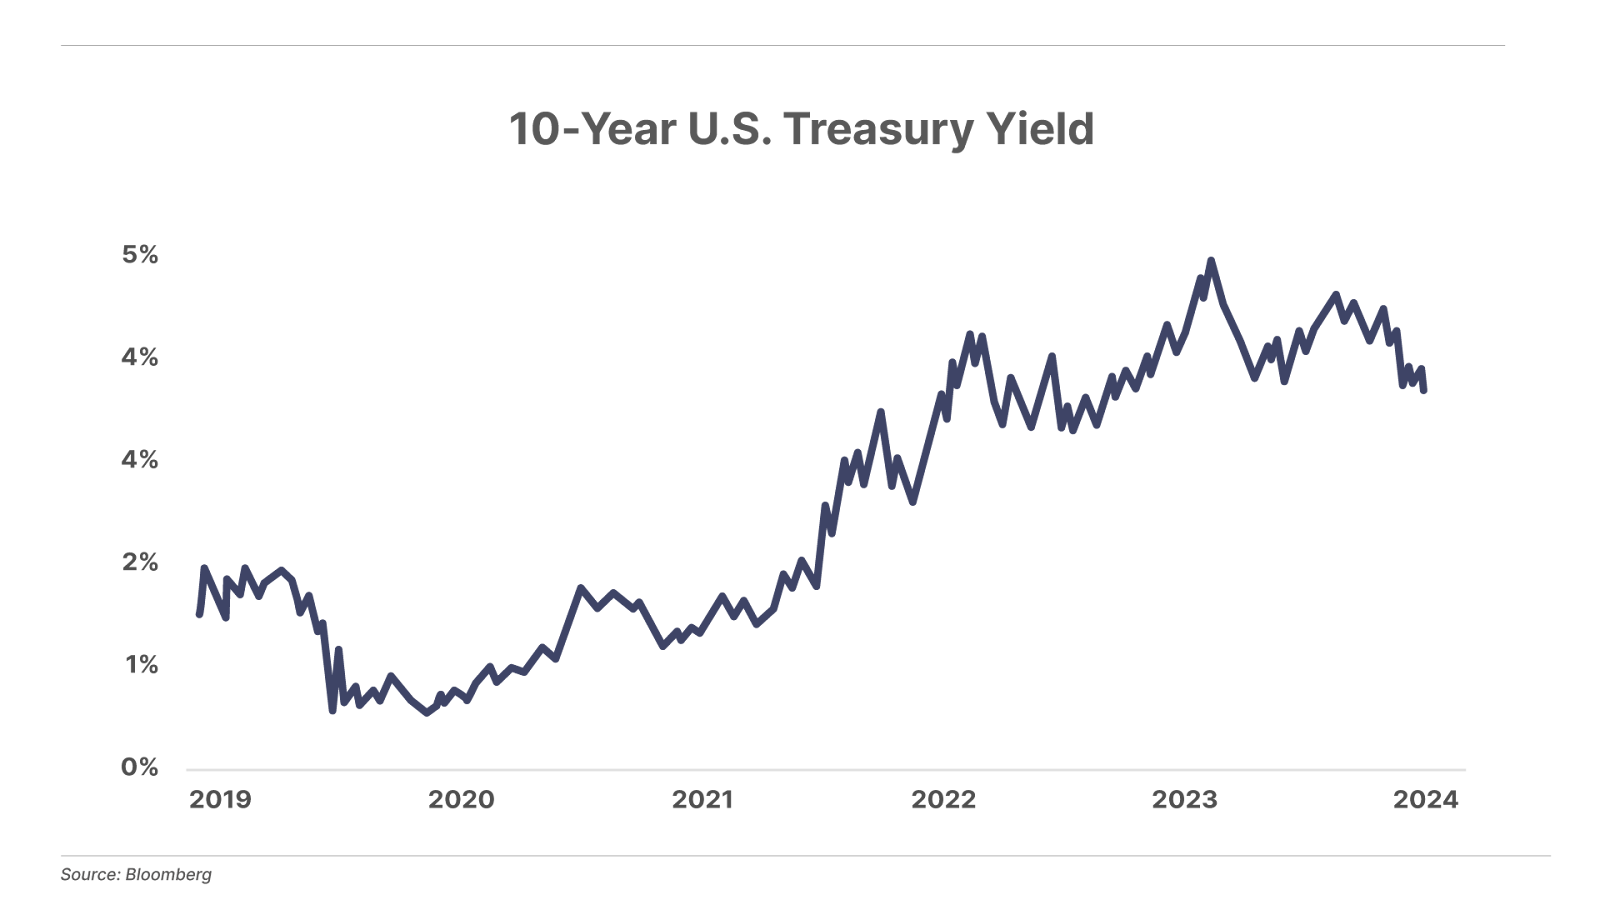
With foreign investors leaving the Treasury market, there’s no realistic chance of the return on the U.S. 10-year bond going below 3%, even if we have a jobs recession. No way.
In fact, I think we’ll see 10-year Treasuries at 5% in the next 12 months. The “misery index” – that is, inflation plus the unemployment rate – will come back. Nobody is pricing that risk into the markets – yet. This means that the Fed’s rate cuts might not be bullish, at all, for stocks.

What Wall Street Hopes You Never Find Out: Most Stocks Lose Money
But there’s one simple rule to follow to make sure you never do.
I’ve got really bad news for you…
Most of you believe that the best way to save for retirement, to build wealth, and even to safeguard your wealth against inflation is to buy and hold stocks. After all, everyone “knows” common stocks offer investors the highest returns over time. Every retirement guide you’ve ever seen shows that stocks outperform gold; stocks outperform bonds; and stocks outperform cash (T-bills).
Except they don’t. Not on average.
And it’s not even close. The truth is: most stocks lose money! And, as a result, I believe, most investors in stocks lose money too.
How do I know? The Center for Research in Security Prices (CRSP) has a database of all the stocks that traded in the U.S. since 1925. In total, this database contains the trading history of 29,078 stocks.
The majority (51.5%) of these securities lost public investors money.
Why does this happen? Well, it’s always seemed obvious to me that the only reason the owners of a privately held company would want to sell the company to the public was that they believed the business was going to decline. In poker, nobody folds the “nuts” – a hand that’s guaranteed to win. Likewise, why sell your company to the public if you know it’s going to keep growing?
The other reason that companies issue stock to the public is, of course, to raise additional risk capital to grow the business. But if your company needs a bunch of money, then it’s probably not doing that well and is at least in some risk of failing.
The history of the last 100 years bears out this idea: most of the time, the public gets fleeced when they buy a stock.
So, why do those books and brochures and finance professors tell us the opposite?
First, because they’re using the S&P 500 Index (or something similar) to measure the performance of stocks as a whole. But the S&P 500 isn’t representative of all stocks. These are the 500 largest (and oldest) publicly traded businesses. And the index is skewed: it holds more of the largest companies and less of the smallest. This has the impact of showing the results of the stocks that succeed, while avoiding the stocks that fail.
To understand stock index investing, you’ve got to remember Pareto’s Law. This describes distributions found in virtually all organic systems. Pareto’s Law predicts that roughly 80% of the output from any organic system will derive from 20% of the population of the system. For example, the 1992 United Nations Human Development Report shows that 20% of the world’s population receives 82.7% of the world’s income. Another interesting case study in the late 1980s showed that video-rental stores received 80% of their revenue from 20% of the videotapes that were stocked.

When you buy the S&P 500, you’re buying the 20% that are most likely to produce 80% of the results. This is why, thanks also to its low costs, index investing is hard to beat over the long term.
But, if you don’t know this, and you simply buy a stock at random, you’re more likely to lose all of your money than to make any!
That’s why at Porter & Co., we specialize in highlighting to our subscribers investment opportunities that are well capitalized, capital efficient, protected by a “moat,” that produce high returns on equity (and invested capital), and that have plenty of room for additional growth.
And there’s one other very important factor that we’ve never addressed before.
This is a bona-fide secret of more than just finance. Like Pareto’s Law, it’s a factor that plays out in all organic systems.
Rather than simply tell you this incredibly powerful factor, I’d like to show you with data from CRSP. Let’s see if you can figure out the secret key to guaranteeing successful investing in common stocks.
You know the first important data point: most stocks fail. The second data point to recognize is that stocks that quickly disappear from the data set produce very poor results.
How do we know?
Well, looking at stocks that produced at least one year of data (that’s 27,751 stocks in the sample) we see that the bottom 10% of these stocks (2,775 stocks) produced average results of negative 98% – total losses, in other words. And the average duration of these outcomes was only two years!
Avoiding these bombs is one key to producing better results on average.
So, let’s see how stocks that produced at least five years’ worth of data performed. We will have eliminated any of the stocks that came onto the public market and then quickly failed.
Looking only at stocks that produced at least five years’ worth of trading produces 12,395 stocks.
But can you believe it…? The annualized returns in this cohort are still negative, minus 6% on average! And, once again, the worst performers (the bottom 10%) have the shortest duration in the database (5.6 years) and the worst results: annualized losses of 40%. The best performers (the top 10%) had an average duration of 17 years and on average they produced 20% annualized results.
Are you beginning to see a picture emerge? Companies that survive the longest, produce the best results.
Looking at companies with at least 20 years’ worth of data (5,139 stocks), we finally discover a positive average return: 4.8%. No, those aren’t great results – on average. But, here we do find the portion of the universe we want to invest in.
The top 10% of the stocks with at least 20 years’ worth of data (513 stocks) produce average results of more than 15% a year.
Looking at this data, you can reach two conclusions.
First, you can believe that these results are simply reflective of “survivorship bias.” That is, we are falsely ascribing significance to the duration of these businesses. They survived because they did the best. But that does not mean they are any more likely to perform well (or to survive) in the future.
I’d say that 99% of investors, analysts, and economists subscribe to that view. It seems very logical.
But there’s another view.
The alternative view, which may seem hard to believe, is that these companies did well because they survived. That is, simply existing for a long enough period confers a meaningful economic advantage to these companies.
That’s true in many other human endeavors. Think about golf courses, for example. Or fashion styles. The longer something has existed, the more likely it is to continue to exist. I believe that’s certainly true about businesses too. And there have been several key breakthroughs in math that help to quantify this phenomenon. It’s called the Lindy Effect. And I’ll explain more about it in our next Journal.
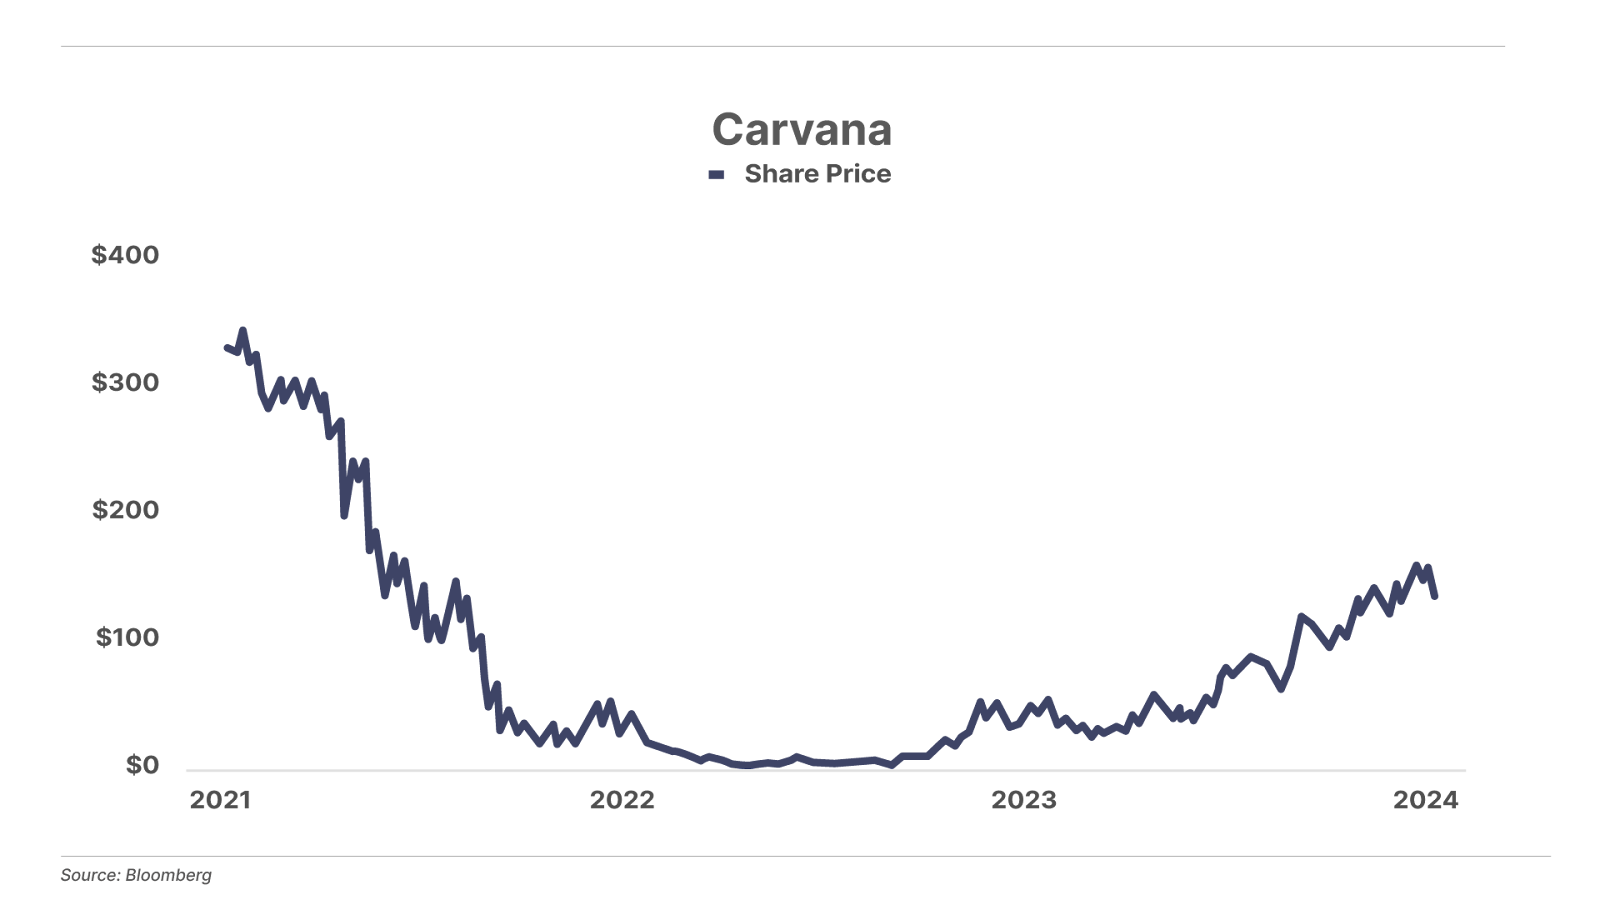
Can Carvana Become the “Amazon of Autos”?
Much like Amazon (AMZN), Carvana’s (CVNA) business model requires enormous amounts of capital, and the company is $4.8 billion in debt. And, like Amazon, Carvana offers consumers a vastly improved experience over the traditional one, selling used cars at fixed prices online and offering delivery.
By investing heavily in their infrastructure, Carvana is now beginning to see the rewards of scale as its gross profit per vehicle sold is now over $7,000 – an incredible accomplishment that demonstrates the value of their service. Unit volume is growing rapidly (up 33% year over year) and the company may be past its Amazon circa 2001 crisis. Wall Street’s analysts are now projecting revenue will double from $13 billion to over $27 billion in the next five years.

Finally…. I’m looking forward to your feedback in the mailbag. Please, let me know what else you’d like to see in my Journal. And, as always, don’t hesitate to tell me about everything we’re doing wrong! Reach me directly at [email protected].
Good investing –
Porter Stansberry
Stevenson, MD
