Issue #44, Volume #1


Why the 1970s Were The “Golden Era” For Warren Buffett And Berkshire Hathaway
Over the upcoming holidays, we won’t be sending you our regularly scheduled research and insight… instead, we’ll be celebrating the “12 Days of Christmas” from December 23 through January 6 by having members of the Porter & Co. team share a favorite (generally investment-related) essay, article, speech, book excerpt, or other text – and their reflections on how it inspired them. Each one will hit your inbox at our usual publication time of 4 pm ET. We hope you enjoy these. Have a wonderful holiday season.
This is Porter & Co.’s free daily e-letter… the last one of 2024. Paid-up members can access their subscriber materials, including our latest recommendations and our “3 Best Buys” for our different portfolios, by going here.
Three Things You Need To Know Now:
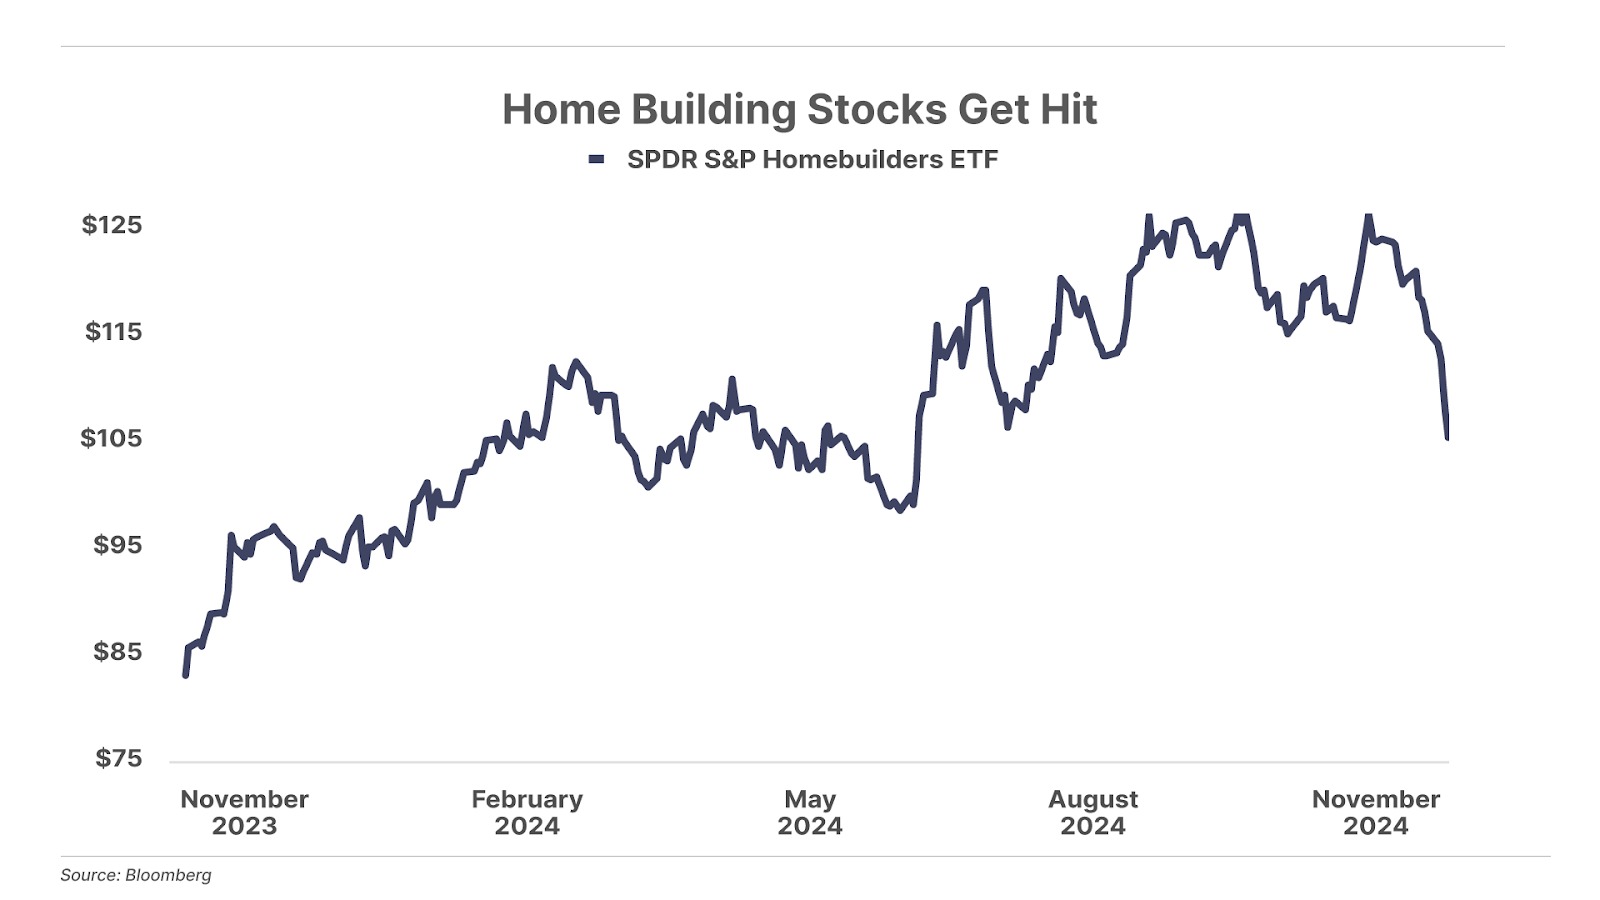
1. Home builders suffer as long-term interest rates rise. The bond market continues to revolt against the Federal Reserve, with long-term interest rates increasing following the Fed’s latest rate cut. The 30-year mortgage rates have risen from 6.1% to 6.7% since the rate cuts began in September. This is a big problem for home builders, which are being forced to cut prices to offset higher borrowing costs. Home-building stocks as a group are down 17% from their recent highs.
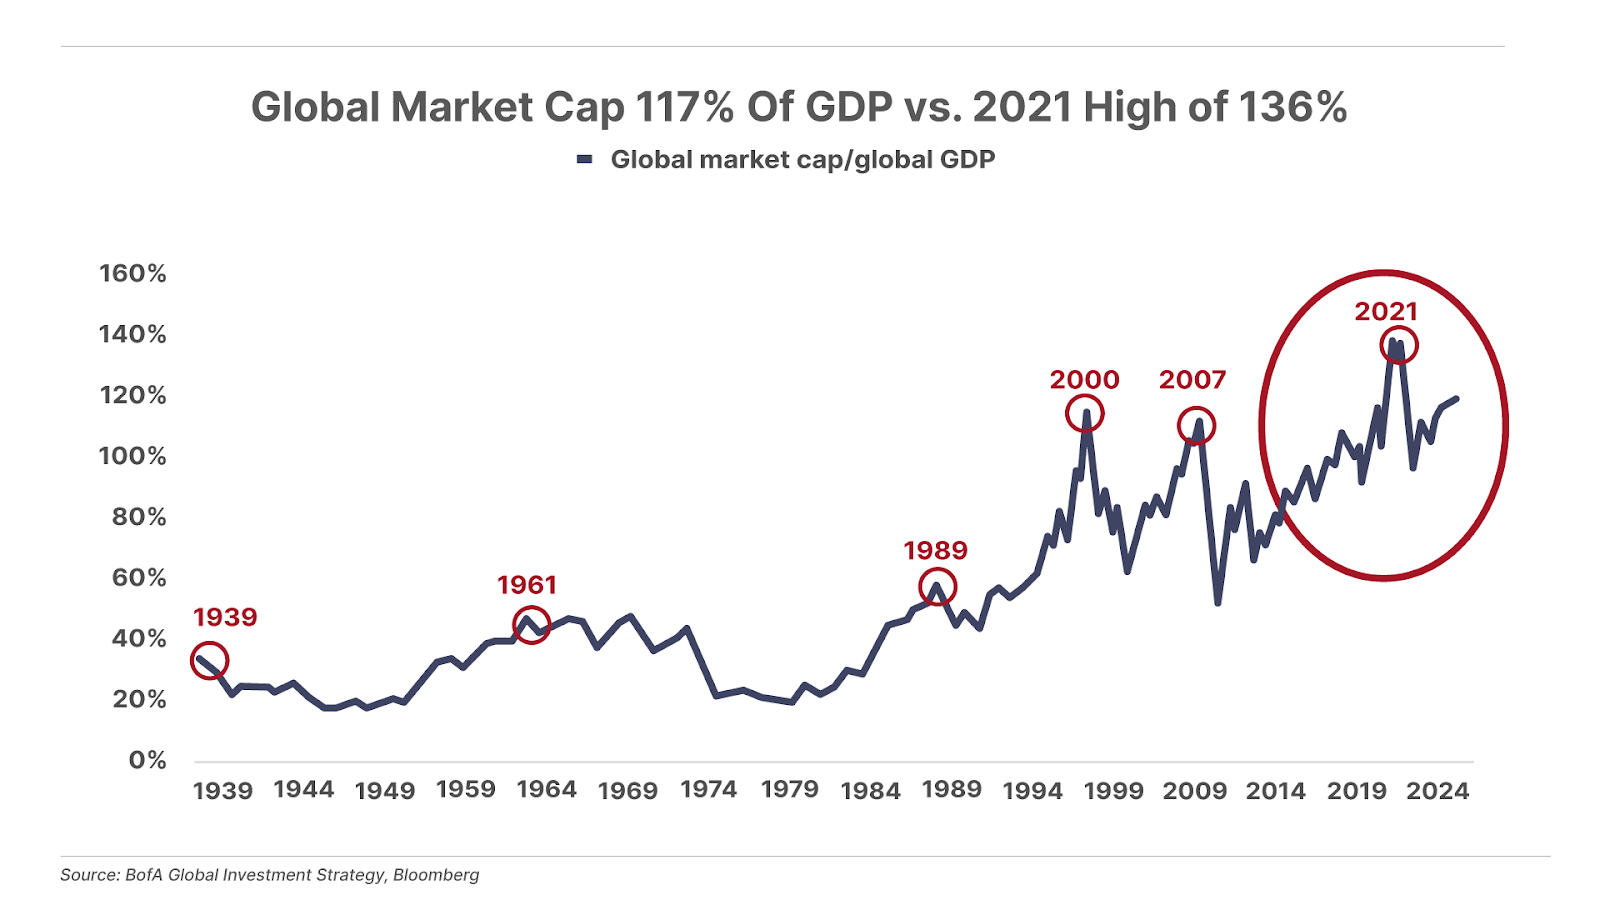
2. The Buffett indicator flashes red. Warren Buffett’s favorite valuation metric compares the value of the broad stock market to gross domestic product (“GDP”). When the metric is above 100%, it suggests that stocks are overvalued relative to the economy. For the U.S., the ratio just hit a new high of 205% (meaning the total value of U.S. markets are more than twice GDP) – well above the dot-com-bubble peak and the 120% 20-year average. Meanwhile, on a global basis (global stock markets compared to global GDP), the indicator is closing in on 2021 all-time highs. Equity markets are frothy everywhere… No wonder Buffett is hoarding cash.
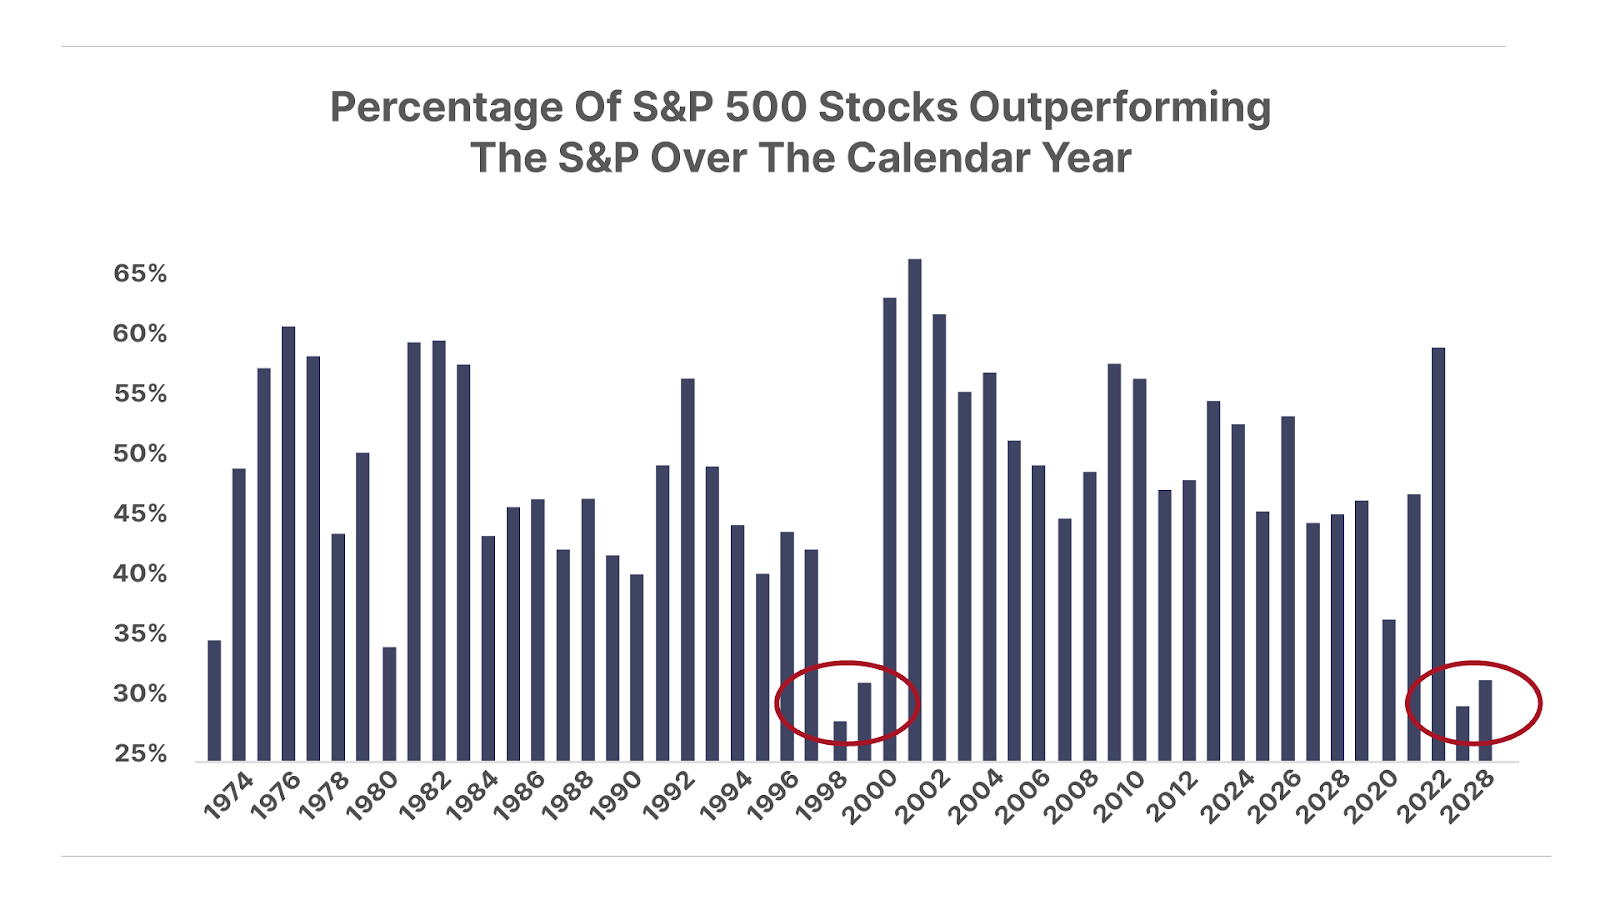
3. When a small number of stocks accounts for almost all of the market’s gains… Most of the time, the performance of a stock index roughly reflects the average performance of the stocks in the index. Over the long term, around half of the stocks in the S&P 500 Index have outperformed the index on an annual basis (and half have… wait for it… underperformed). But in 2024, just 32% of the constituent stocks of the S&P 500 have outperformed the index… meaning that 68% have done worse than the 29% year-to-date return of the S&P 500. That kind of lopsided performance has happened only a few times in the past: in 2023… and in 1998 and 1999, just before the dot-com bust. Market breadth is a signal of a healthy rally, which is the opposite of what we have today. Don’t say we didn’t warn you…
In Case You Missed It:
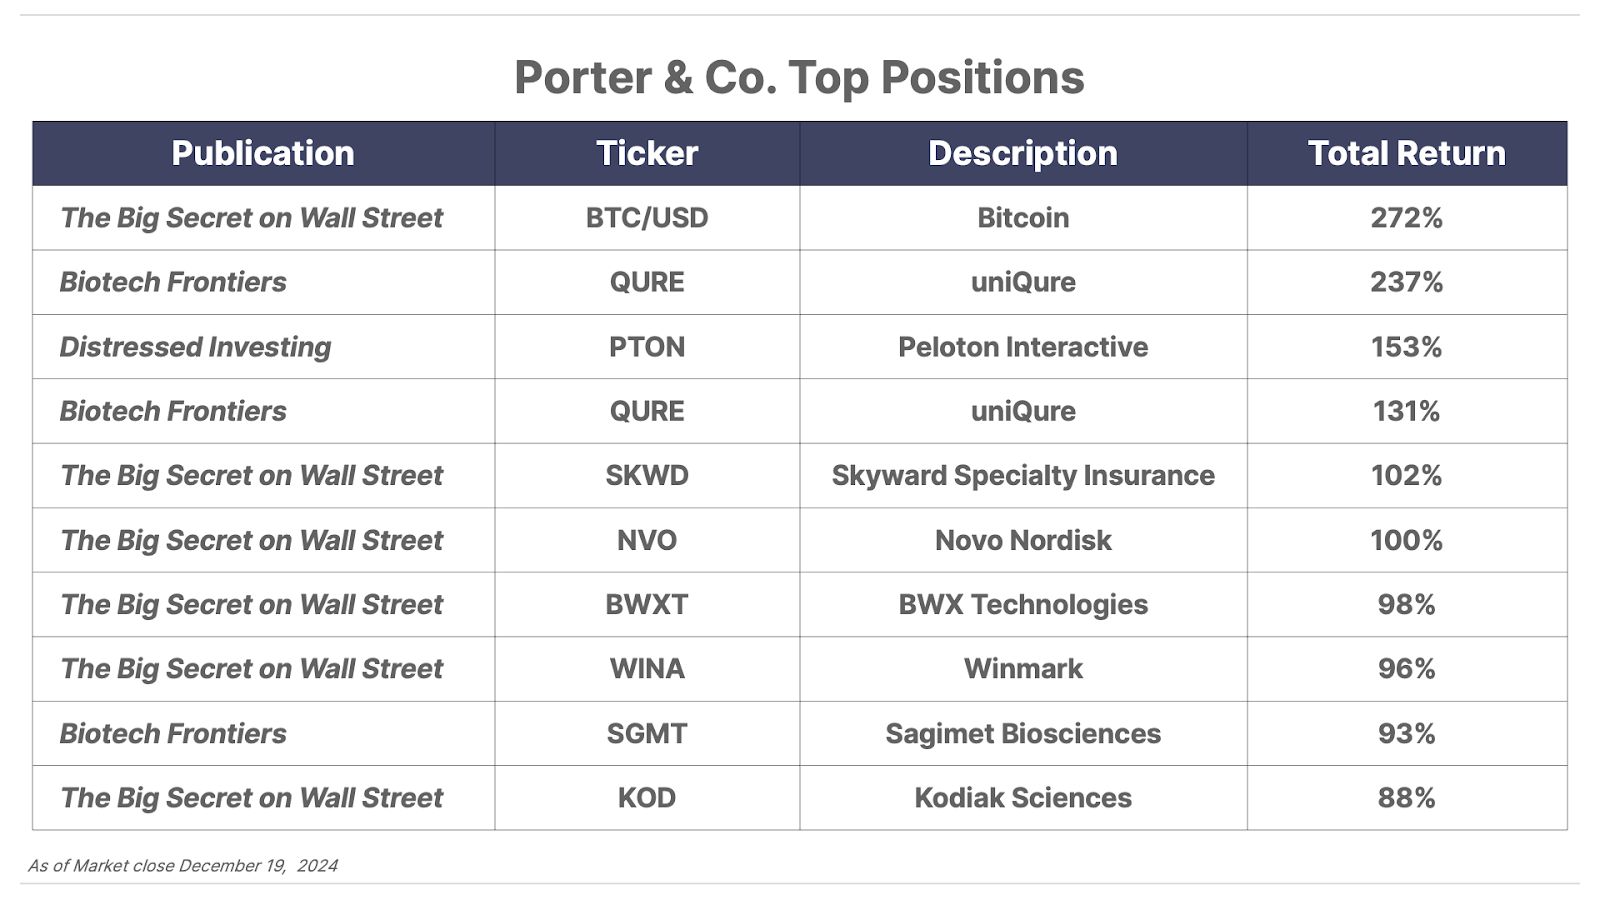
Thursday’s issue of The Big Secret on Wall Street – our last one before the holiday break… featuring our yearly “Naughty List” breakdown of companies that deserve a big sack of coal. And for subscribers… an update on our top three stocks from the Big Secret portfolio.
And, coming up on Monday… Big Secret subscribers (and Partner Pass members) get a special early Christmas gift… our Trump’s Secret Stocks report, with six recommendations – ideas that you won’t have seen anywhere else – set to profit from the new administration.
If you’re not already, become a Big Secret member now… here… if you’d like to receive this report as soon as it’s released.
Here We Go Again: Welcome To The 1970s
Why the 1970s Were The “Golden Era” For Warren Buffett And Berkshire Hathaway
America loves inflation.
As a democracy with universal suffrage, it is inevitable that our political leaders will always spend more than they can afford. The same, by the way, will be true for Donald Trump’s second term.
It’s also inevitable that politicians will use fear and propaganda to manipulate voters and to gain support for outrageous spending. Like P.T. Barnum taught: You’ll never go broke underestimating the intelligence of the American people. There’s virtually nothing Americans won’t believe.
Look at the nonsense we’ve spent trillions on over the last 50 years or so: the “missile gap” of 1960 and the Cold War that followed ($15 trillion); the “domino theory” that led to the Vietnam War and our involvement in countless other pointless civil wars ($5 trillion); the threat of “weapons of mass destruction” and the global war on “terror” ($10 trillion).
The dangers of these things were exaggerated in ways historians will find laughable. But these fears were used to win elections and enable enormous amounts of government spending. And that’s just the military claptrap. There’s also the global warming boondoggle and, let’s not forget, “two weeks to flatten the curve” ($7 trillion).
It was the “Cold War,” the “domino theory,” and John F. Kennedy’s fear of a non-existent “missile gap” that first propelled the government into extreme debt.
The U.S. went from a surplus in 1960 to an incredible $25 billion deficit in 1968. In total, between 1960 and 1974, the government would add $230 billion in debt, which was an extraordinary 50% of 1960s GDP. Notable deficits occurred in ’68, ’71, and ’72 (each over $20 billion). These deficits couldn’t be financed legitimately, so President Richard Nixon turned to the printing press, abandoning gold. And then, with nothing to restrain government borrowing and spending, these cycles have continued – and have gotten much, much worse.
Using inflation to finance the federal government (and fear to get elected) has become standard, orthodox policy. That’s created an enormous wealth gap between Americans with assets (like real estate, stocks, and Bitcoin) that increase in value with inflation – and wage earners with only cash savings.
Just consider the relative size of the ongoing inflation. The 1960s and early 1970s saw deficits and debts equal to about 50% of GDP at the beginning of the inflation. Our current cycle is much, much worse.
In 2000, U.S. GDP was $10 trillion. Since then, we’ve added $22 trillion in debt.
Notable deficits (over $1 trillion) occurred in every year of President Barack Obama’s first term (2009, 2010, 2011, and 2012) and every year of his third term, including $2.7 trillion in 2021 and almost unbelievably $1.8 trillion in 2024.
Additionally, there was the enormous $3.1 trillion “COVID deficit” in 2020.
The point is, there’s a very good reason that the next few years are going to look a lot like the 1970s.
Once again, we’re at a point in the endless cycle of government deficit spending where the government’s debts and deficits are negatively impacting the real economy. The enormous issuance of new government bonds is crowding out private sector borrowing – especially mortgages. While some amount of government deficit spending can stimulate economic activity (and juice financial asset prices), when those debts and deficits begin to result in substantial amounts of inflation, then, suddenly, the real cost of these actions becomes clear.
Soon, we’ll see the return of the “misery index,” which is calculated by adding the inflation rate and the unemployment rate. My bet is that by the end of 2025 we’ll see a double-digit misery index, with inflation running at around 6% and a similar rate of unemployment.
The bond market knows what’s coming. That’s why, as the Federal Reserve has continued to cut interest rates – including another 25 basis points on Wednesday – bond yields have been moving up. That’s not completely unprecedented, but – as the graph below shows – we’re seeing the biggest rise in yields during an interest rate cutting cycle in decades. The last time bonds behaved this way, in the pre-1981 cutting cycle (the light-blue line below)… during which inflation and yields hit century highs.
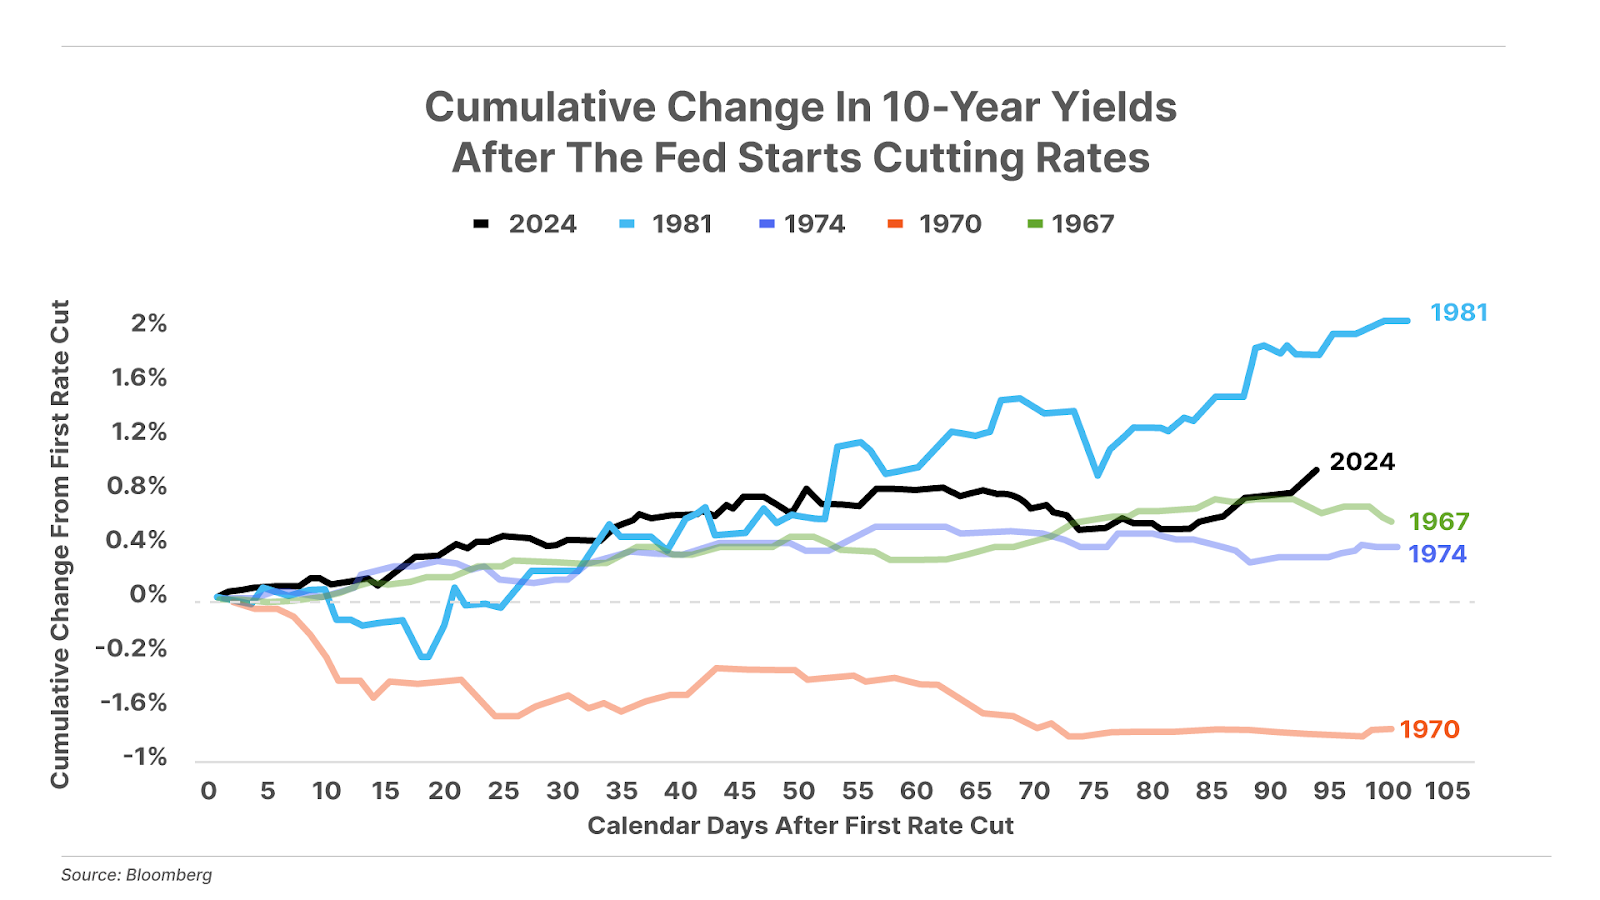
Sharply rising inflation and unemployment are not priced into the stock market, which is why I think you’re going to see a very different pattern in the market over the next four to six years.
Since 1982, we’ve seen a long period of declining inflation and interest rates. Lower interest rates have pushed up the prices of financial assets, as the market has traded at higher and higher multiples of earnings. Now the market will have to “fight” higher rates, which means stock prices will adjust lower because of more competition from short-term interest rates.
Why take the risk of stocks when you can get 5% in risk-free T-bills?
A good rule of thumb is to divide the number one by the current T-bill rate to figure out where the market should be in terms of an earnings multiple (1 / T-bill rate = market earnings multiple).
Today the iShares 1-3 Month Treasury Bill ETF (BIL) is yielding 5.1%.
So, 1 / 5.1 = 19.6
Meanwhile, the current trailing 12-month earnings multiple of the S&P 500 is 30.6.
This all implies that a 35% move lower in the S&P 500 would only return the market to a reasonable valuation, relative to interest rates.
In my career, I’ve never seen the market more overvalued relative to T-bill rates than it is now. This is not going to end well for most investors.
During the 1970s, these same forces led to a huge bear market in ’73-’74 – with the market falling more than 50%. And, back then, just like today, prior to this massive market correction investors had stampeded into a very small number of blue chip stocks (the Nifty Fifty).
I am not uncertain that we are going to see a similar, massive bear market caused by rising inflation, increasing interest rates, and the resulting “reset” to the market multiple. And, while investors who continue to hit the “feeder bar” of buying the S&P 500 every month in their 401(k)s will suffer very poor returns, for investors who understand how to value securities, this will be a golden age of opportunity.
The 1970s were (in percentage terms) Warren Buffett and Berkshire Hathaway’s best decade.
From 1969 to 1979, Berkshire’s book value per share grew from $42 to $336, up 700% in the decade. But almost all of these gains came after the major bear market of ’73-’74, when stocks had their first major “reset” following the major deficits of 1968, 1971, and 1972.
Berkshire grew 21.9% in ’75. Then an incredible 59.3% in ’76. It grew 24% in ’78. And then 35.7% in 1979.
Today, we’re still waiting for the major reset of the market’s earnings multiple, as interest rates are going to follow inflation higher because of the massive deficit spending of Obama’s third term.
And, now, with the government’s debts far larger than our GDP, it’s clear that we’re at a point in the cycle when a panic could easily develop, with interest rates going much, much higher than anyone expects today.
We live in interesting times.
After the ongoing reset of the market’s earnings multiple (which could easily take another six to eight months) I believe we will see a once-in-a-lifetime opportunity emerge in high-quality small-cap stocks, whose valuations never became inflated in the recent S&P 500 Index / Magnificent 7 bubble. The S&P Value Index has fallen an incredible 14 days in a row – the longest losing streak ever.
At some point, investors will throw in the towel, and we’ll see some outrageously good opportunities. Stay tuned.
It’s proof that, like in the 1970s, we are at a point in the cycle where the market cannot tolerate more government deficits without seeing inflation.
Good investing,
Porter Stansberry
Stevenson, MD
Mailbag
As always, we’d love to hear what you think: [email protected]
Today’s letter is from Kim M., who writes:
I am wondering, Porter: Am I at risk by having a decades-old Merrill Lynch stock account, which as you know is owned by Bank of America? I don’t do any traditional banking with Bank of America, but have been reading how you “think” the bank itself is at risk due to its real estate mortgage business, etc. Could the brokerage business (account holders) be compromised if the bank comes upon hard times?
Thanks and Merry Christmas!
Kim
Porter’s reply: Beats me. I’m an equity analyst, not a lawyer.
Kim M.’s reply: Really.
Porter’s comment: I apologize if you thought I was being flippant or negligent. But you’re asking me an incredibly technical legal question and, quite honestly, I wouldn’t trust the advice of any lawyer on this issue. The government will do what it wants. Look at the General Motors (GM) bankruptcy, for example. Or the endless number of laws that flagrantly violate the 14th Amendment.
The other question I have for you is: When the analyst who predicted the demise of General Electric, GM, Fannie Mae, Freddie Mac, and Boeing says that Bank of America is a zero… What else could you possibly need to know?
How stupid are you?
That’s the question I’d ask in return.
Warm regards,
Porter

P.S. In our September 10 Porter & Co. Spotlight, my old friend Tom Dyson at Bonner Private Research recommended the shares of Zim Integrated Shipping (ZIM).
Over the next two weeks… the shares moved up 50%.
That’s extraordinary. And it’s unusual.
There aren’t many real geniuses in the investment business. Tom is one of them.
And he’s produced fantastic results. He piled into gold in the early 2000s… bought Bitcoin at $1 in 2013… I could give you a dozen more stories like that.
And one of them is Zim.
But the reason you should read Tom Dyson each week isn’t merely because he will bring you outrageously good investment ideas.
You should read him each week because he understands the emotional challenges of putting capital at risk and, unlike anyone else in this business, he can guide you through those challenges.
Good investment ideas are important… and mastering your emotions while navigating those ideas is at least as important. And Tom’s a master at that.
Tom won’t just give you great investment ideas: he will sit in the foxhole with you and fight.
Read him and you’ll see immediately what I mean.
You can access Tom’s research – at a special rate for Porter & Co. subscribers – here. It’s fantastic value for the money… I don’t know why anyone wouldn’t want to be able to tap into Tom’s brain.
