Issue #35, Volume #2


When Things Go Bad, Wealth Can Evaporate
This is Porter’s Daily Journal, a free e-letter from Porter & Co. that provides unfiltered insights on markets, the economy, and life to help readers become better investors. It includes weekday editions and two weekend editions… and is free to all subscribers.
| The Magnificent 7 has been propping up the S&P 500… Now almost all seven mega-cap tech stocks are near bear market territory… Where they could go from here… Subprime auto-loan delinquencies hit record high… Copper starts to shine… |
I (Ross Hendricks) ended Monday’s Daily Journal by pointing out that in the past two years, without shares of the Magnificent 7 – Alphabet (GOOG), Amazon (AMZN), Apple (AAPL), Meta (META), Microsoft (MSFT), Nvidia (NVDA), Tesla (TSLA) – the S&P 500’s back-to-back 20% annual gains would have been more like 5% on average in each of those years.
Then I wrote, sharing the following chart to illustrate the point…
“Now, here’s where things become concerning: nearly all of the Mag-7 stocks have either entered a bear market (down 20% or more), or are on the verge of it” (three have climbed out of bear territory since last week, but only by a few percentage points):
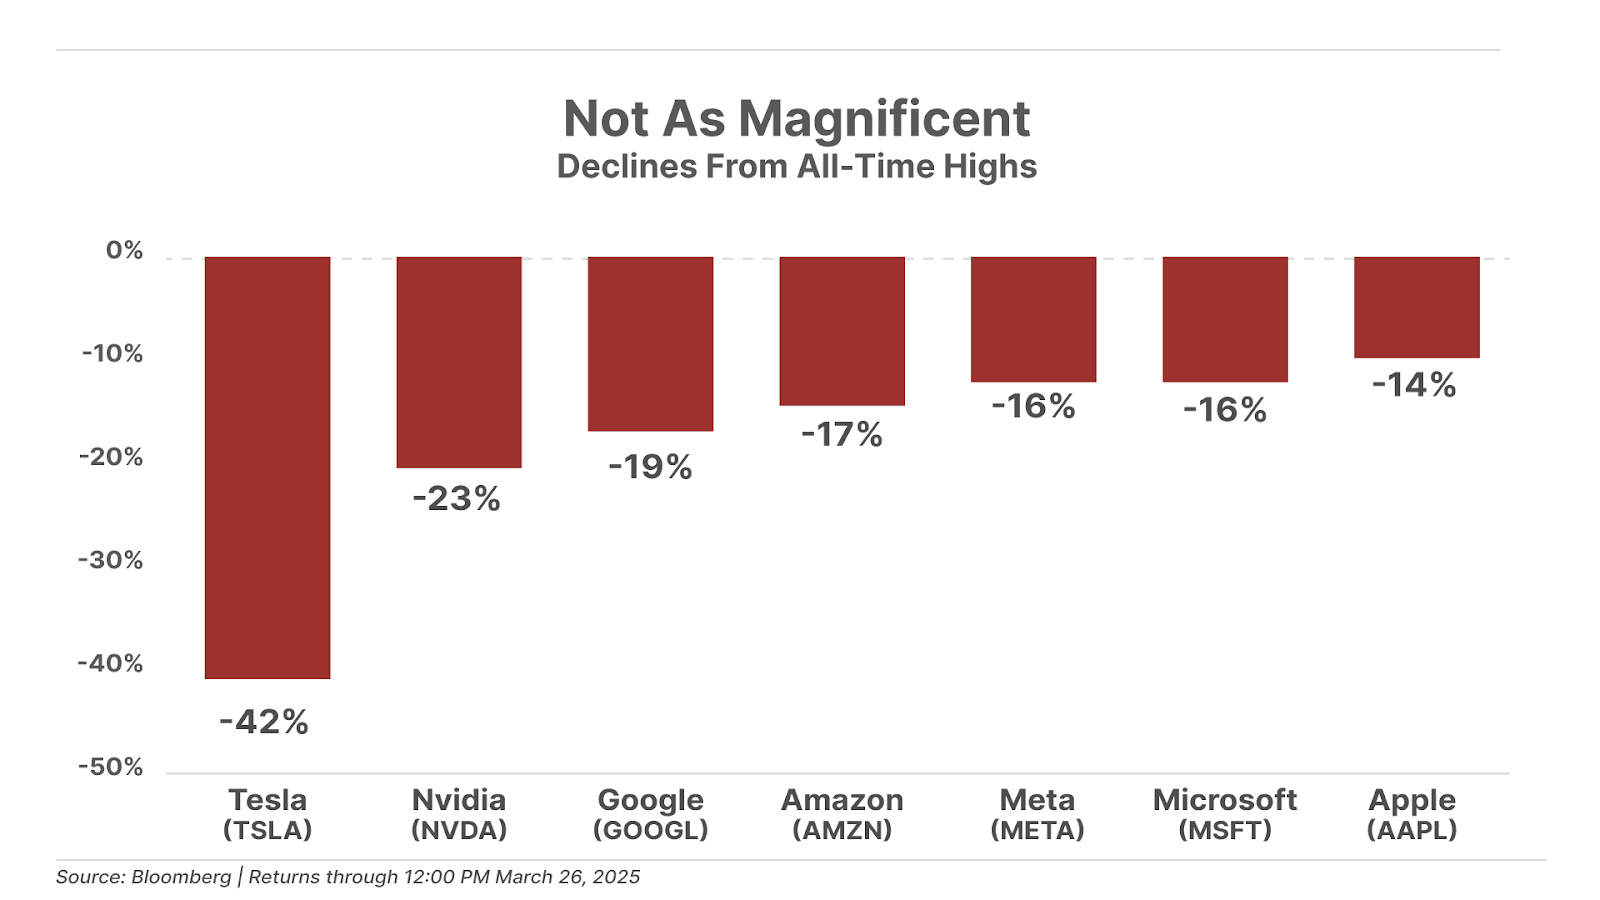
Given their outsized weight in the overall market – these seven tech giants make up 35% weighting in the S&P 500 – the losses in the Mag-7 cohort was the major contributor to the S&P 500 dropping more than 10% from February 19 to March 13.
And that brings us to a key vulnerability facing the U.S. economy: the end of the record “wealth effect” created from the greatest bull market of the last 50 years, which removes the key pillar of strength holding up the U.S. economy – the boom in consumption by wealthy asset owners.
That’s because all signs indicate that the same group of stocks that led the market higher over the past few years are now set to lead the market lower.
The major factor behind the Mag-7 gains since 2023, which have driven the majority of overall gains in the S&P 500, has come from optimism over the artificial intelligence (“AI”) revolution. But so far, the only thing most of these companies have created from the AI revolution is investor optimism, which has resulted in higher share prices.
So far, Nvidia is the only Mag-7 company seeing an uplift in revenue and profits from the AI revolution, as a seller of the “picks and shovels” of this boom: its AI-enabling graphics processing chips (“GPU”). But Nvidia’s gains have largely come at the expense of its largest customers, the four big tech firms: Amazon, Meta, Microsoft, and Alphabet.
The combined capex budgets of these four companies will exceed $200 billion this year, a nearly 10-fold increase in their combined capex spending from a decade ago. Most of this money is going toward buying Nvidia GPUs and the associated data center infrastructure to support them.
But much of this money has thus far seemingly gone into a capex black hole, as these companies have largely failed to generate any meaningful returns on their AI investments. As a result, the AI spending spree is blowing a hole through their cash flow statements. The capex spending spree is merely turning today’s tech giants away from their former glory of capital-light, cash-printing machines into increasingly capital-intensive business models – as we’ve written about previously in the case of Google parent company Alphabet.
The rising capital intensity of the Mag-7 is only half of the problem. The other half is the tens of billions of dollars in stock-based compensation these companies issue each year – another number that has soared during the recent bull market. While the accounting rules ensure that stock compensation doesn’t directly impact cash flows, it’s a very real cost to investors that shouldn’t be ignored.
Most of the MAG-7 companies try to offset the dilution of issuing stock compensation with stock buybacks. In this case, cash flow that would have otherwise been available for shareholders is instead used to offset the dilution of issuing new shares to employees.
That’s why we created a cash flow metric that we believe more accurately captures the real economic returns available to shareholders from owning these companies. We call it “shareholder free cash flow,” defined as the amount of cash flow left over for shareholders after accounting for capex and stock-based compensation. (The standard free cash flow computation accounts for capex, but not for stock-based compensation.)
The table below shows the price-to-shareholder free cash flow valuations for each of the Mag-7 companies. Note that not a single one trades for less than 30x shareholder free cash flow multiple:
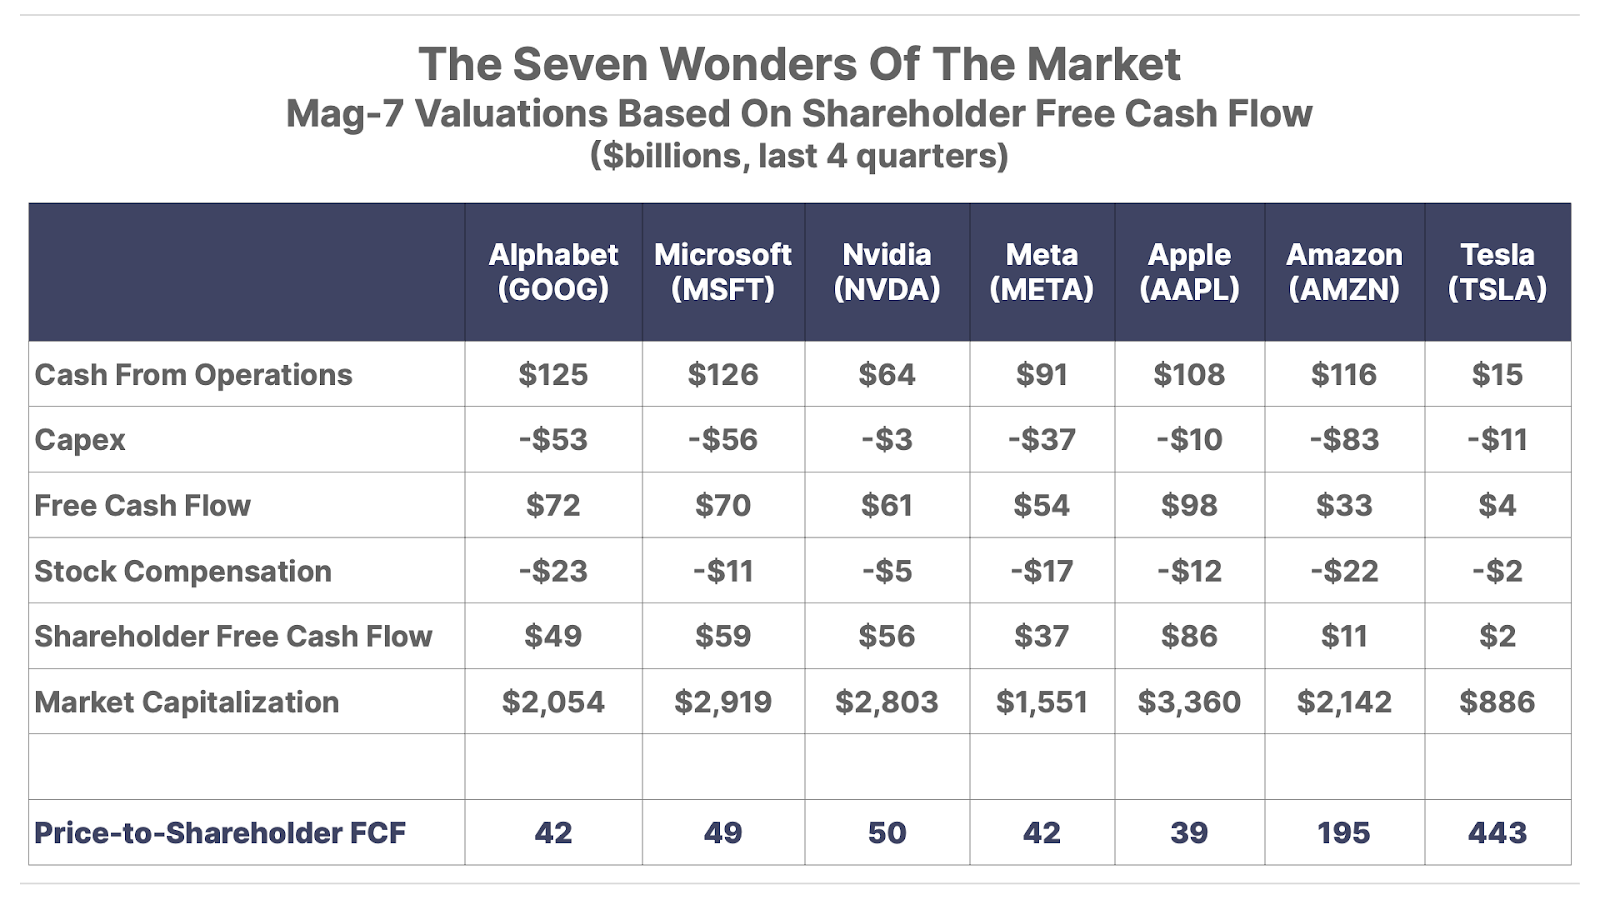
This price-to-shareholder free cash flow metric reflects the multiple investors are paying for each dollar of cash flows available for distribution back to investors. What’s the right multiple? Well, consider that right now, investors can earn a risk-free 4% cash return from owning Treasury bills, reflecting a 25x multiple. And on average over the last 30 years, the S&P 500 has traded at that same 25x free cash flow multiple (but reaching as low as 11x during bear markets).
Given the increasing capital intensity of the Mag-7, and the growing risks of a recession, we believe a 25x shareholder free cash flow multiple is a reasonable valuation level these companies could trade down before finding support from value-oriented investors. And that implies an average downside risk of 57% across the Mag-7 cohort.
But here’s the problem – these valuation multiples are all based on the cash flows generated during the highly supportive economic environment of 2024.
As we described earlier, all signs indicate the growing chance of a recession in 2025. And remember, the early weakness showing up in the consumer spending data to start the year was before $5 trillion in wealth was shaved off of the U.S. stock market. This creates the growing risk of a self-reinforcing downward spiral, where lower stock prices lead to less consumption, which in turn leads to weaker earnings growth and thus lower stock prices, and so on.
After all, what happens to sales of $1,000 smartphones and $50,000 electric vehicles in a recession? Or what about the digital advertising budgets across corporate America, which make up the majority of revenue for the Mag-7? And if revenue for the big tech companies begin to soften, what happens to their appetite to pour hundreds of billions into AI data centers that are currently pushing the stock price of other tech companies higher?
These are the questions investors should have answers to if they have any meaningful exposure to U.S. stock prices. And while the cheerleaders in the financial media are busy at work assuring investors that “valuations are reasonable” after the recent 10% drop in the S&P 500, our advice is to ignore them.
For one, the pundits routinely cite the S&P 500 based on the “forward” price-to-earnings (P/E) ratio, which is based on the consensus analyst estimates of the earnings in 2025. Wall Street analysts are currently calling for a 10% increase in S&P 500 EPS, from $246 last year to $270 this year. With the S&P 500 trading at 5,700 points, that puts the forward P/E ratio at roughly 21x, a “reasonable valuation” according to the consensus narrative.
There are a few big problems with these assumptions that ignore all historical precedent.
First, the average P/E ratio of the S&P 500 over the last decade is 16x. And that figure can easily drop below average during a bear market. Meanwhile, Wall Street analysts have a horrible track record at predicting recessions, when earnings will typically drop by 20% to 30%. And when you combine a recession with a bear market – an unexpected drop in earnings, and a contraction in the valuation multiple – can lead to outsized losses.
Consider the case of the 2007-2009 recession.
In October 2007, Wall Street analysts were calling for S&P 500 companies to increase their earnings per share by 8% year over year to reach $105 in 2008. Instead, as the recession took hold and consumer spending dropped, earnings fell by 25% to $71 per share.
Meanwhile, the S&P 500 traded at what seemed like a “cheap” valuation of 15x earnings going into 2008. But as the market panic set in, the multiple that investors were willing to pay dropped by 35% to 10x earnings at the bottom of the bear market in March 2009.
This 25% drop in earnings and a 35% drop in valuation multiples is what caused the 50% decline in the S&P 500 from 2007 to 2009.
We see no reason why a similar decline couldn’t happen from current levels.
All it would take is a scenario where, instead of increasing by 10% this year, S&P 500 earnings drop by 25%, from $246 last year to $185. And meanwhile, during bear markets, investors become much more risk averse, causing them to pay less for each dollar of earnings. So while the S&P 500 has traded at an average of 16x earnings historically, that number reflects investors paying above-average multiples during bull markets and below average multiples during bear markets. Thus, we could see a scenario where the S&P 500 drops to roughly 14x earnings in the event of a recession-driven bear market (a conservative downside estimate versus the 10x multiple reached during the prior recession in 2008 – 2009).
In a scenario where earnings drop by 25%, and investors decide they’re only willing to pay 14x earnings to own the S&P 500 instead of 21x, this would put the S&P 500 at 2,600, more than 50% lower than where it is now.
And again, this isn’t even an extreme set of assumptions. There’s always a possibility for a more severe recession where earnings drop by more than 25%, or the valuation multiple of the market falls to around the 10x P/E multiple of the depths of the 2007-2009 bear market.
Of course, in that scenario stocks would be a screaming buy. The problem is, anyone listening to the financial pundits claiming stocks are attractively valued at today’s levels will not have the cash available to capitalize on such an opportunity.
That’s why we continue to recommend that investors exercise extreme caution in today’s market. We believe a time will come when stocks offer a no-brainer, screaming buying opportunity. But at 21x the rosy analyst estimates for 2025, today’s prices are far removed from offering that opportunity.
| Wanted… Porter & Co. Seeks Time-Tested Trader Do you know anyone who is a battle-tested trader with years of street cred, deep market insight, and the scars and medals to prove it?… Porter & Co. is looking for such a person to lead our premium trading research service, to deliver high-impact ideas to our subscribers. If this isn’t you, please note that we offer a generous finder’s fee if you refer the right candidate. |
Three Things To Know Before We Go…
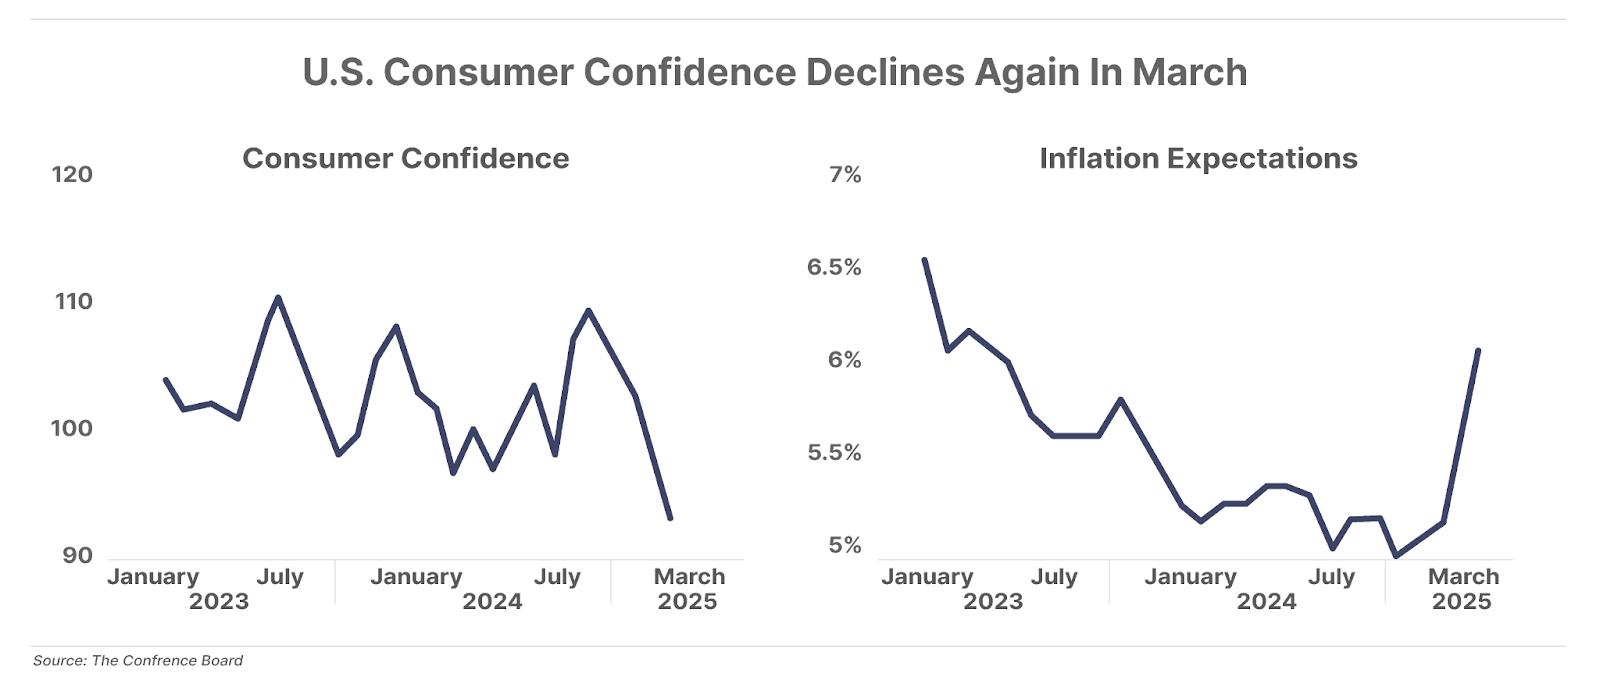
1. U.S. consumer confidence plunges in March. On Tuesday, The Conference Board announced that its Consumer Confidence Index fell by 7.2 points in March to 92.9, marking the fourth consecutive monthly decline and its lowest level since August 2021. Consumers are increasingly pessimistic about their job security, economic conditions, and (lack of) income growth. Inflation concerns are also intensifying, with expected inflation rising to 6.2% (compared to the current level of 2.8%) over the next 12 months. If consumer sentiment continues to decline and spending slows, the economy is at real risk of a downturn.
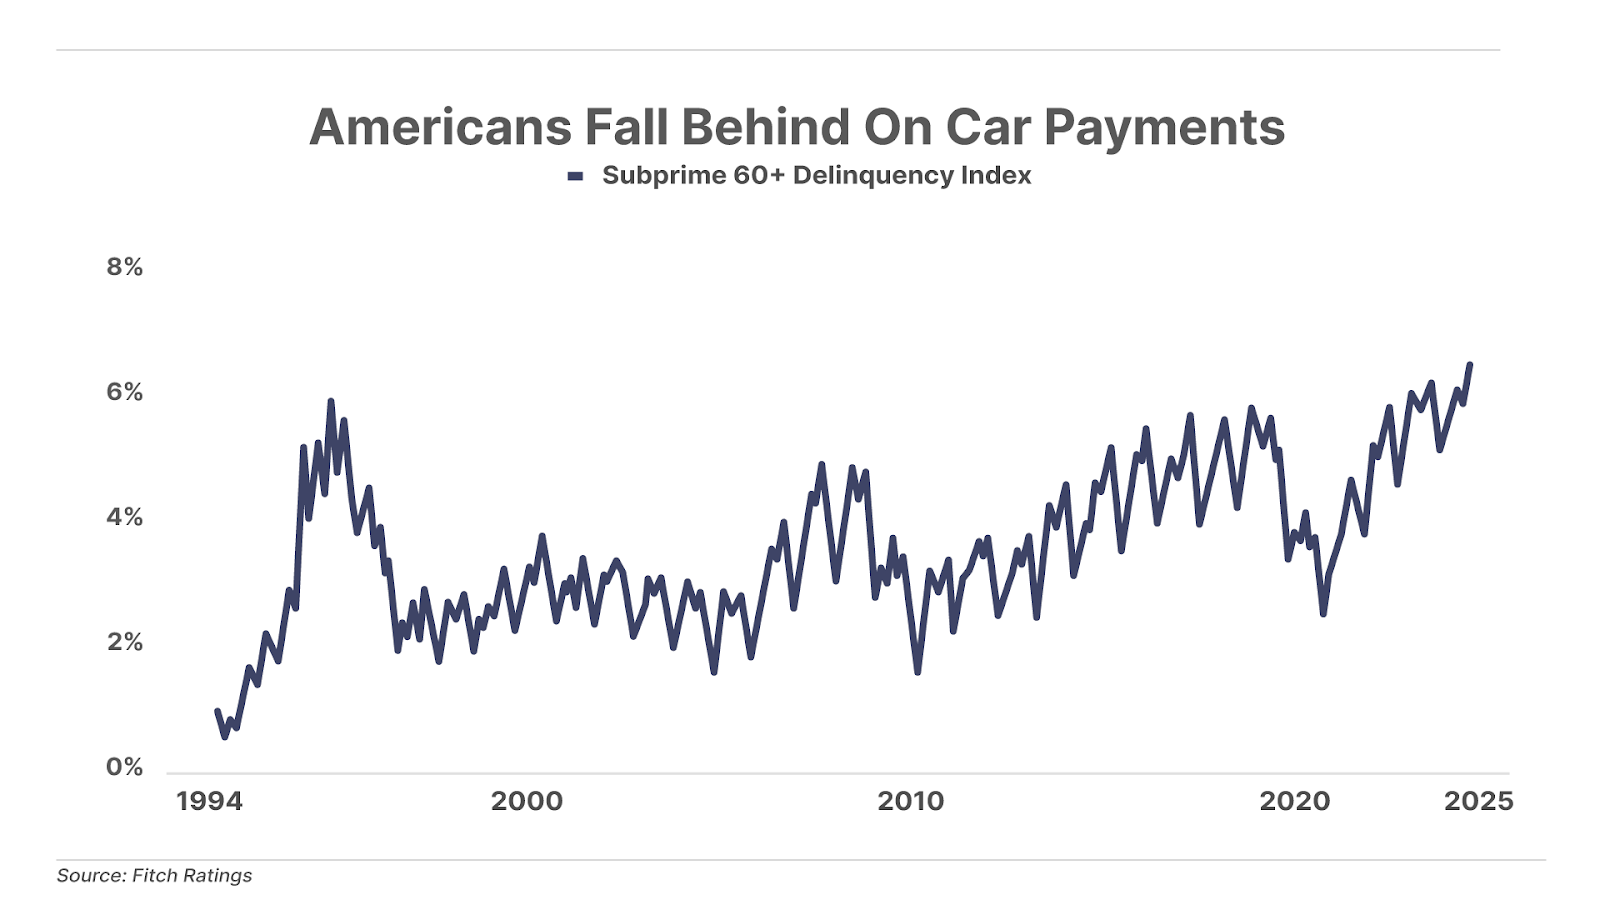
2. Subprime auto-loan delinquencies hit a new high. Credit ratings agency Fitch reports that the number of subprime auto borrowers at least 60 days late on their payments jumped to 6.6% of the total in January – the highest level on record since the agency began collecting data in the mid 1990s. Consumers are being squeezed by the high cost of new vehicles, now averaging just under $50,000; and by continued growth in insurance rates, up 19% year on year. This record-high default rate among subprime auto loans is the latest sign of ongoing stress on the U.S. consumer.
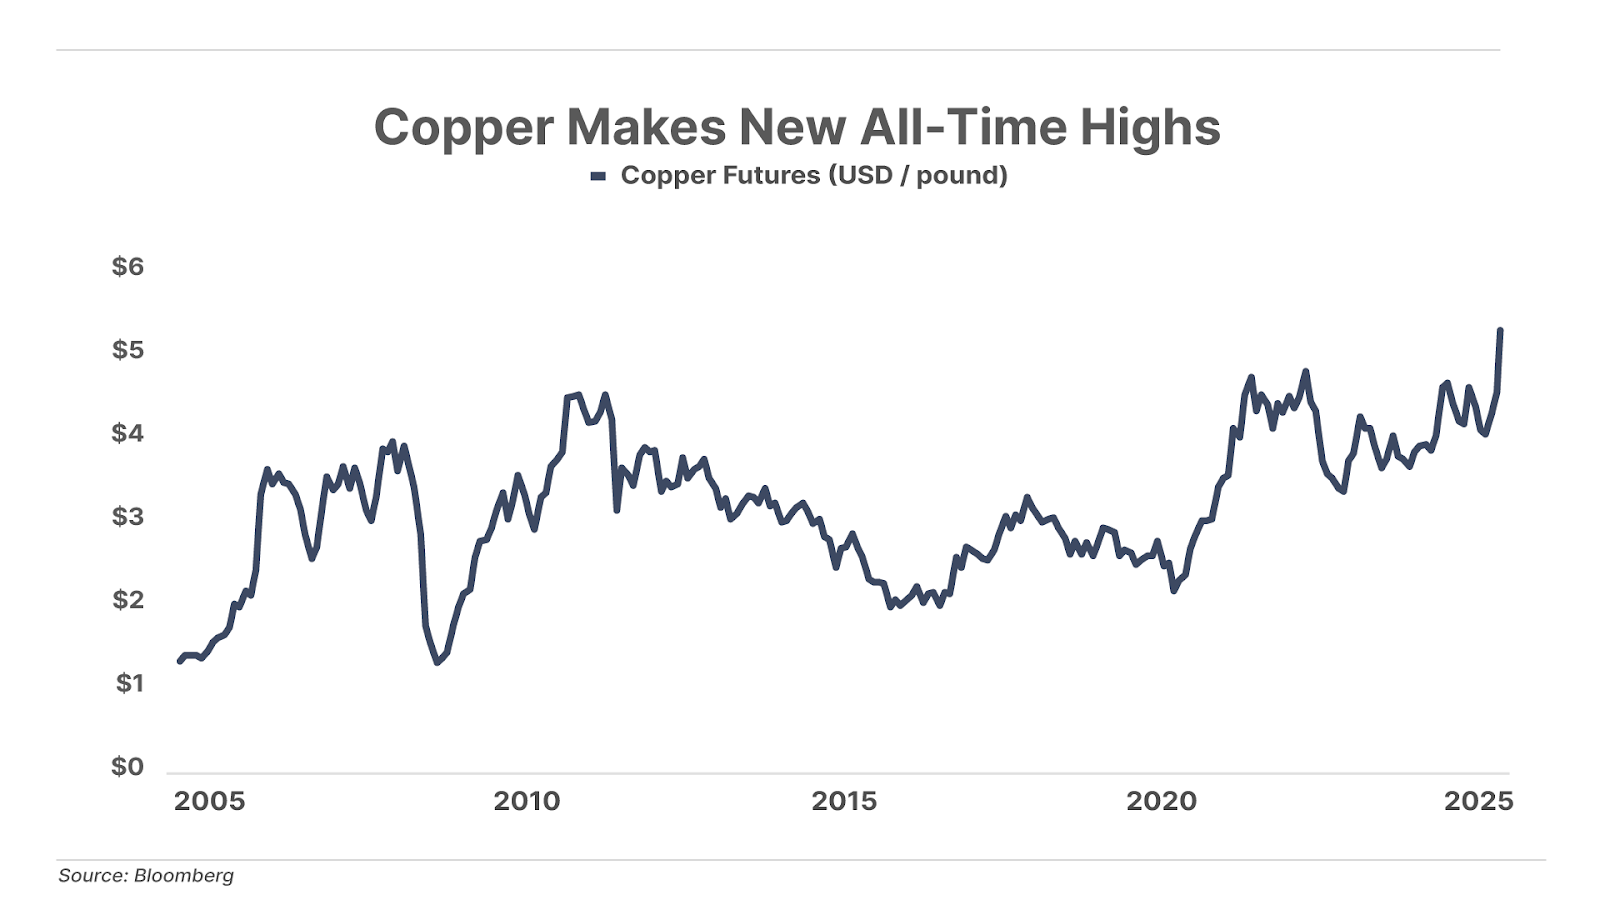
3. “Dr. Copper” is optimistic. While we’re tracking plenty of worrisome signs for the U.S. economy (see above), not all the data is so negative. Copper – the critical industrial metal long said to have a “Ph.D. in economics” for its ability to act as a leading indicator of global economic activity – just made an all-time high this week. Though some of this strength is likely due to industry front-running potential tariffs, copper is also responding to expectations of additional stimulus in China (the world’s top consumer of industrial metals) and increased European defense spending, both of which could spur significant economic growth outside the U.S.
And one more thing… Poll: Valuing The S&P 500
As always, drop us a line if you agree, disagree, or just want to comment on anything we published or linked to… [email protected]
Chinese Issue New Financial Threat to America
Presented by Jim Rickards
The global economic war has arrived.
This announcement from China means they are set to implement massive tariffs on America any day now.
Are you going to learn how to leverage this global trade war to potentially generate returns 1,000% or more in a matter of months as this plays out?
Or are you going to sit on the sideline and become one of the victims in this new economic war?
Click here and I’ll show you everything you need to do.

Mailbag
Hi Porter,
Since I’m pretty new at this, I obviously have a lot to learn.
Based on your recommendations, I have bought Deere & Co. (up 21%), PM (up 29%), HSY (up 9%), and MCD (up 3%) in my IRA. Thank you!
Here’s my question:
Since several of those currently have high P/Es, is it better to sell those now (Deere, PM, and MCD), capture the gains and wait until P/Es are below 15 to reinvest in them? I will put more money in HSY now… just wondering if the others are due an adjustment and if I should capture the profits.
Just wasn’t sure since I won’t be taxed on anything until I take IRA distributions, which is a few years off.
Thanks, Porter… I am trying to learn, baby, learn.
Jody”
Porter’s comment: You’re asking a great question. And if I knew what those stock prices were going to do tomorrow, or over the next six months, I promise I would tell you.
Since I can’t know that (and since I don’t believe anyone else can either), I’d suggest asking yourself a different question: what is your objective as an investor?
When you bought those stocks, was it your objective to make 20%, in the short-term? If so, then you’re not an investor – you’re a trader. You’re trying to maximize your short-term results. There’s nothing wrong with being a trader. If you think you can accurately forecast short-term price swings – and many people believe they can – then this strategy will work for you.
I’ve found, over many years, that’s much harder than it looks.
And what will you do with your capital while you’re waiting?
On the other hand, being an investor requires fewer decisions and less uncertainty.
An investor is someone who seeks to own great businesses, as long as they can provide higher and higher dividends. Obviously, you could, in the future, decide the opportunity to see your dividends grow is much better in some other business than these. If so, you might wisely decide to sell some of these shares and buy a different great business. Your capital is finite and opportunity is infinite – so there will always be more good investment ideas than available capital. But I don’t think you’re likely to improve your results by simply trading in and out of the same stocks. Not unless, as I said, you’re a very good trader.
As for me, I’ve learned the hard way (many times) that there are very few things you can know for certain about tomorrow. I’m virtually certain that my grandchildren will eat food that’s been cultivated by Deere & Co. tractors. I’m virtually certain they will, at the very least, experiment with Philip Morris products. I’m extremely certain they will eat Hershey’s chocolate and enjoy McDonald’s burgers. I’m also virtually certain that these companies’ business models and brands will allow them to continue to generate market-beating returns on their equity: these are incredibly good businesses.
As a result, I’m virtually certain that if I buy these stocks with some margin of safety (at a relatively low price relative to their earnings), I will achieve good returns over time. Probably even results that far outpace the market.
But I have absolutely no certainty about the near-term share prices of these companies. If there’s a nuclear bomb that goes off in Ukraine tomorrow, these share prices could fall a lot. Likewise, if the current U.S. government loses control of the deficit, and interest rates spike into double digits.
There are many, many things that could go wrong, which would make a decision to sell now look wise.
On the other hand, if your goal is to build wealth over the next decade, are those risks relevant?
As always, these are only my own thoughts. Not advice.
I am a new Partner Pass member and was reading your old reports on liquefied natural gas (“LNG”). Have you published anything regarding your current thoughts on the LNG market?
Lake L.”
Porter’s comment: Yes, we have written a great deal about the LNG market. In fact, earlier in March, we recommended shares of a liquefied natural gas (“LNG”) exporter in The Big Secret On Wall Street. It is a superbly managed LNG export business. It’s minting money… is growing fast… and is dead cheap.
Big Secret subscribers and Partner Pass members can read the recommendation right here.
To get the name, ticker symbol, and full report on this company – and the nearly 40 other stocks in The Big Secret portfolio (including nine others in the “Energy & Commodities” category), become a subscriber. Click here to learn more… or call Lance James, our Director of Customer Care, at 888-610-8895 or internationally at +1 443-815-4447.
Good investing,
Ross Hendricks
Houston, Texas
P.S. Through it all, gold continues to rise… today, the price of gold again cracked the $3,000-per-ounce level – and chances are that soon, it will leave that psychological barrier behind for good.
Gold has over time shown to be astonishingly good portfolio insurance: When the world is going down the drain, gold consistently stands – and gains – ground. And in recent months, it’s been far more than insurance – it’s been portfolio fuel.
But there are good ways to invest in gold… and better ways to invest in gold.
Which is which? Marin Katusa has thoughts. Marin – a friend of Porter’s – is one of the world’s premier experts on investing in natural resources, and gold in particular.
To see what Marin has to say, see his presentation here.
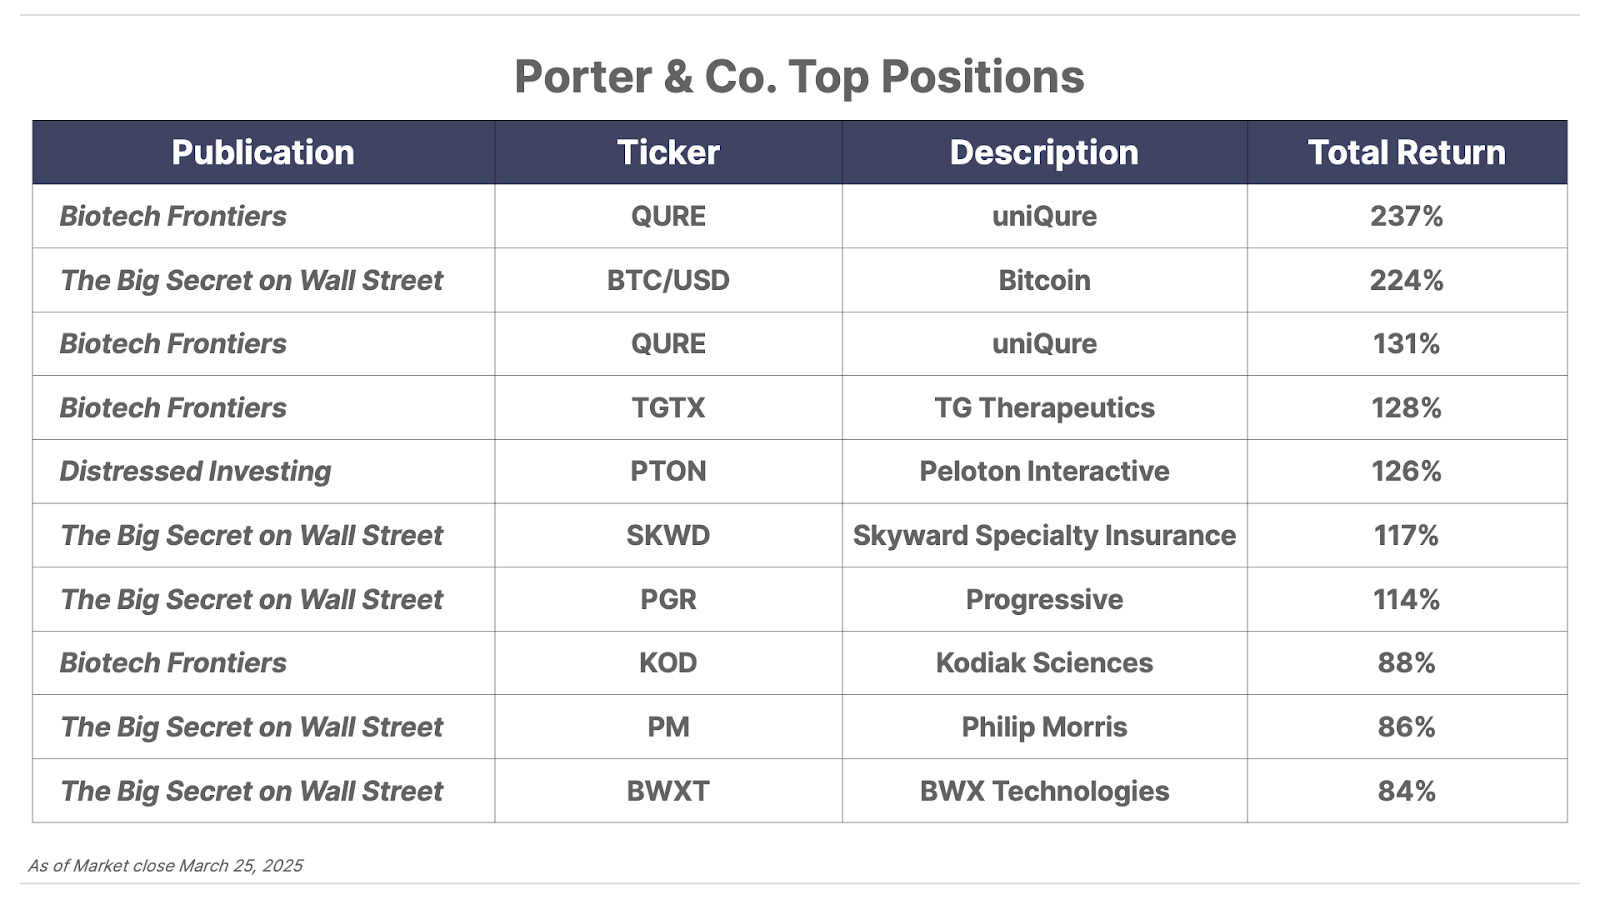
Please note: The investments in our “Porter & Co. Top Positions” should not be considered current recommendations. These positions are the best performers across our publications – and the securities listed may (or may not) be above the current buy-up-to price. To learn more, visit the current portfolio page of the relevant service, here. To gain access or to learn more about our current portfolios, call Lance James, our Director of Customer Care, at 888-610-8895 or internationally at +1 443-815-4447.