Issue #4, Volume #2


It Will Take 10 Years To Rebound
This is Porter & Co.’s free e-letter, the Daily Journal. Paid-up members can access their subscriber materials, including our latest recommendations and our “3 Best Buys” for our different portfolios, by going here.
Three Things You Need To Know Now:
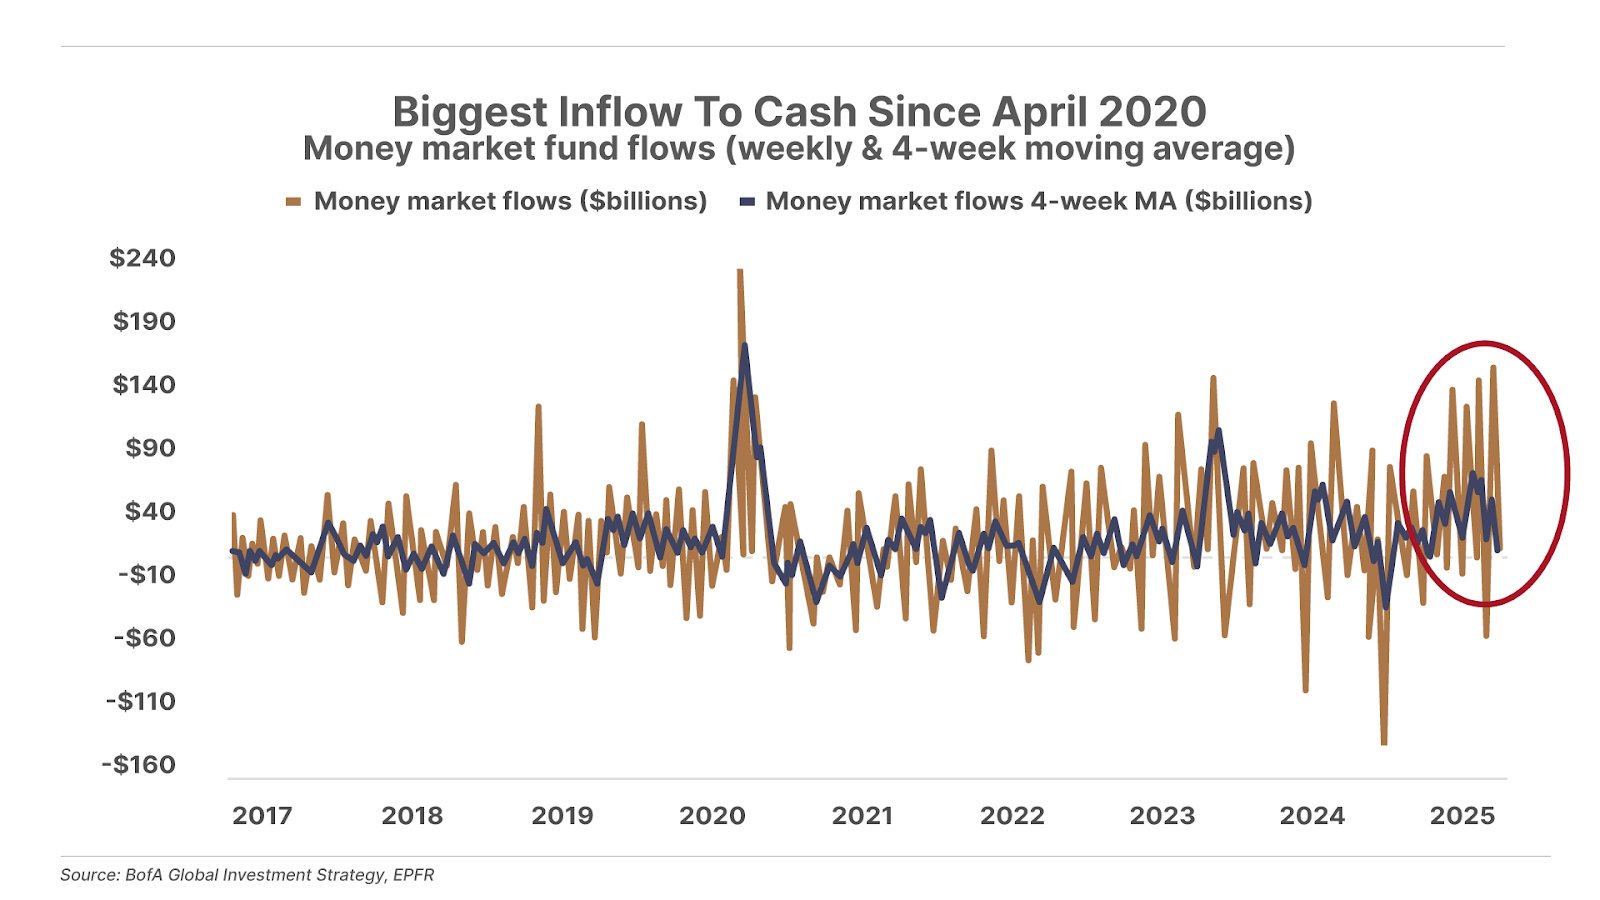
1. “Higher for longer” is back. Fed rate-cut expectations have plunged following last week’s stronger-than-expected jobs report. The market is now pricing in just two additional cuts for all of 2025 versus expectations for six in September (though we wouldn’t be surprised if there were zero cuts this year). In anticipation of rates being higher for longer, money market funds experienced $143 billion in inflows last week, the biggest weekly rise since April 2020. Total U.S. money market assets now sit at a record $6.9 trillion.
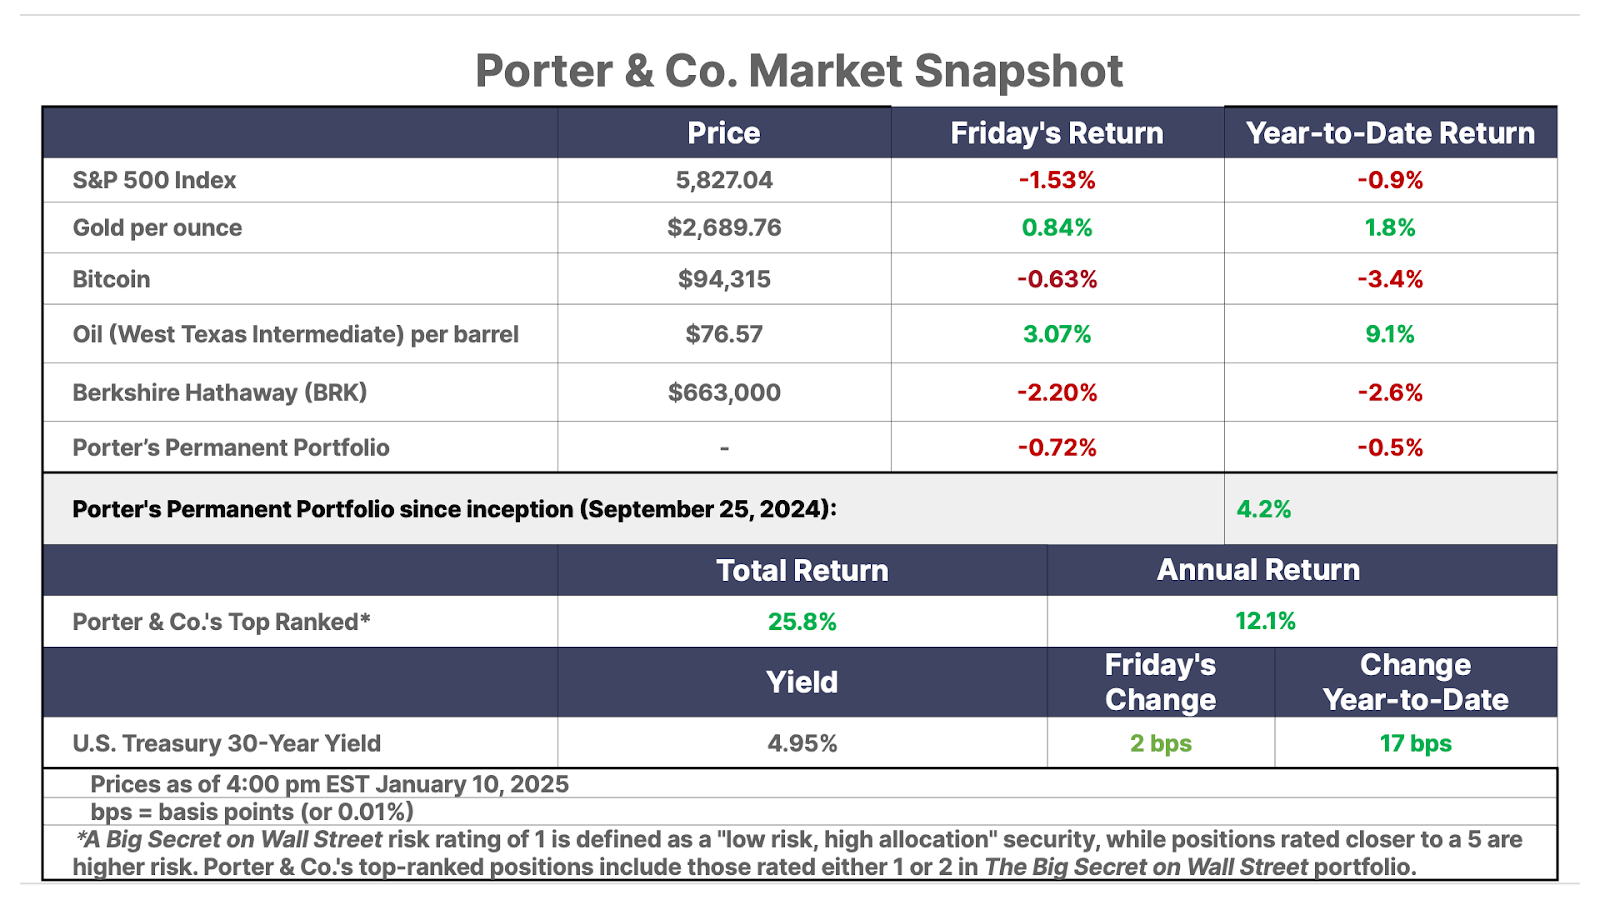
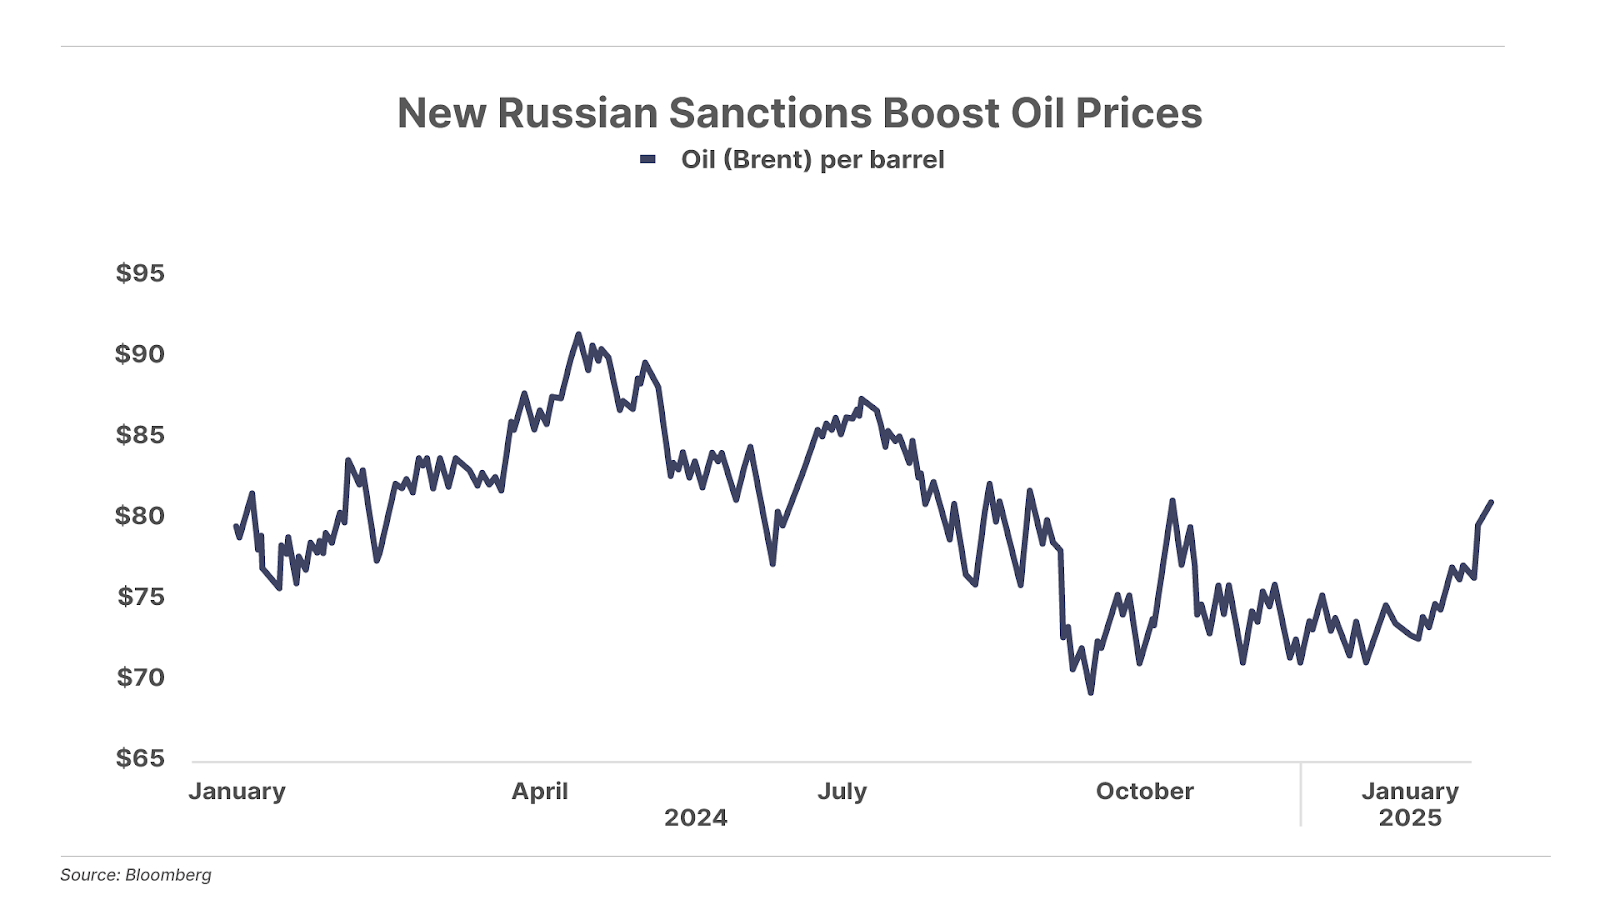
2. New Russian sanctions could accelerate oil rally. On Friday, the outgoing Biden administration more than tripled the number of Russian shipping vessels on the sanctions list to 183. Many of these vessels were part of the shadow fleet of tankers Russia used to divert oil from its former European customers into China and India. These new sanctions could take a significant volume of Russian oil supplies off the global markets, likely boosting crude oil prices, which are already up 10% for the year, and are at a three-month high.
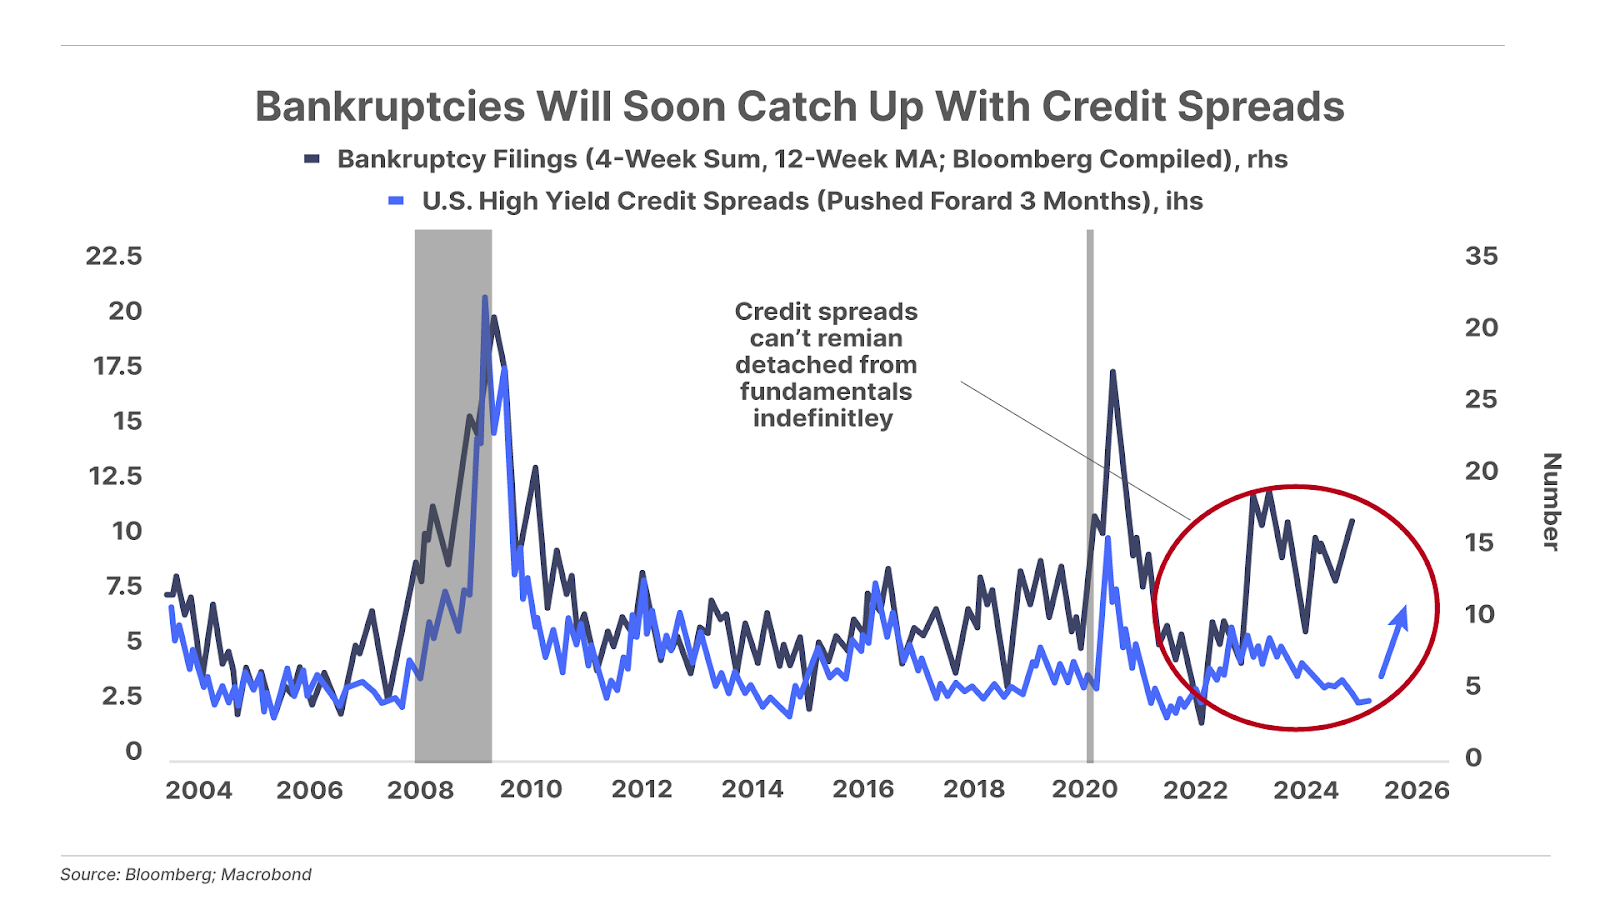
3. The coming bankruptcy boom. (Marty Fridson of Porter & Co.’s Distressed Investing explains…) Over the past year, corporate bankruptcies have risen to a level previously witnessed only in recessions. Meanwhile, the risk premium on high-yield bonds – the yield spread over Treasury bonds – fell to the lower end of past levels during economic expansions. Those two trends are fundamentally out of whack with each other. The disparity is partly explained by reduced supply of high-yield bonds, as a lot of financing by lower-rated companies has shifted toward the private credit market. But when demand for public, speculative-grade bonds eventually drops off in the face of escalating credit risk, the high-yield spread versus Treasuries will widen substantially. Widening spreads will push more high-yield bonds into distressed territory. That means a wider range of choices for distressed investors, which works to their advantage. As the distressed universe increases, more issues slip in that don’t really deserve to be traded at such depressed levels.
And one more thing…
Coming up this week: Inflation and spending both keep ticking upwards. Tuesday and Wednesday will bring December’s consumer-price (“CPI”) and producer-price (“PPI”) inflation data, with CPI expected to increase to 2.8%, up from November’s 2.7%. PPI growth is projected to cool a little, a 0.3% increase compared to November’s 0.4%. On Thursday, we’ll see December’s retail sales data, expected to be up 1.7% month over month (it was up 0.7% in November) and 7.2% year over year (beating November’s 3.8%)… and finally, on Friday, analysts anticipate a slight boost for December industrial production (up 0.3%, after a November increase of 0.1%) and housing starts data (up 2% in December, after being down 1.8% the month prior).
In Case You Missed It…
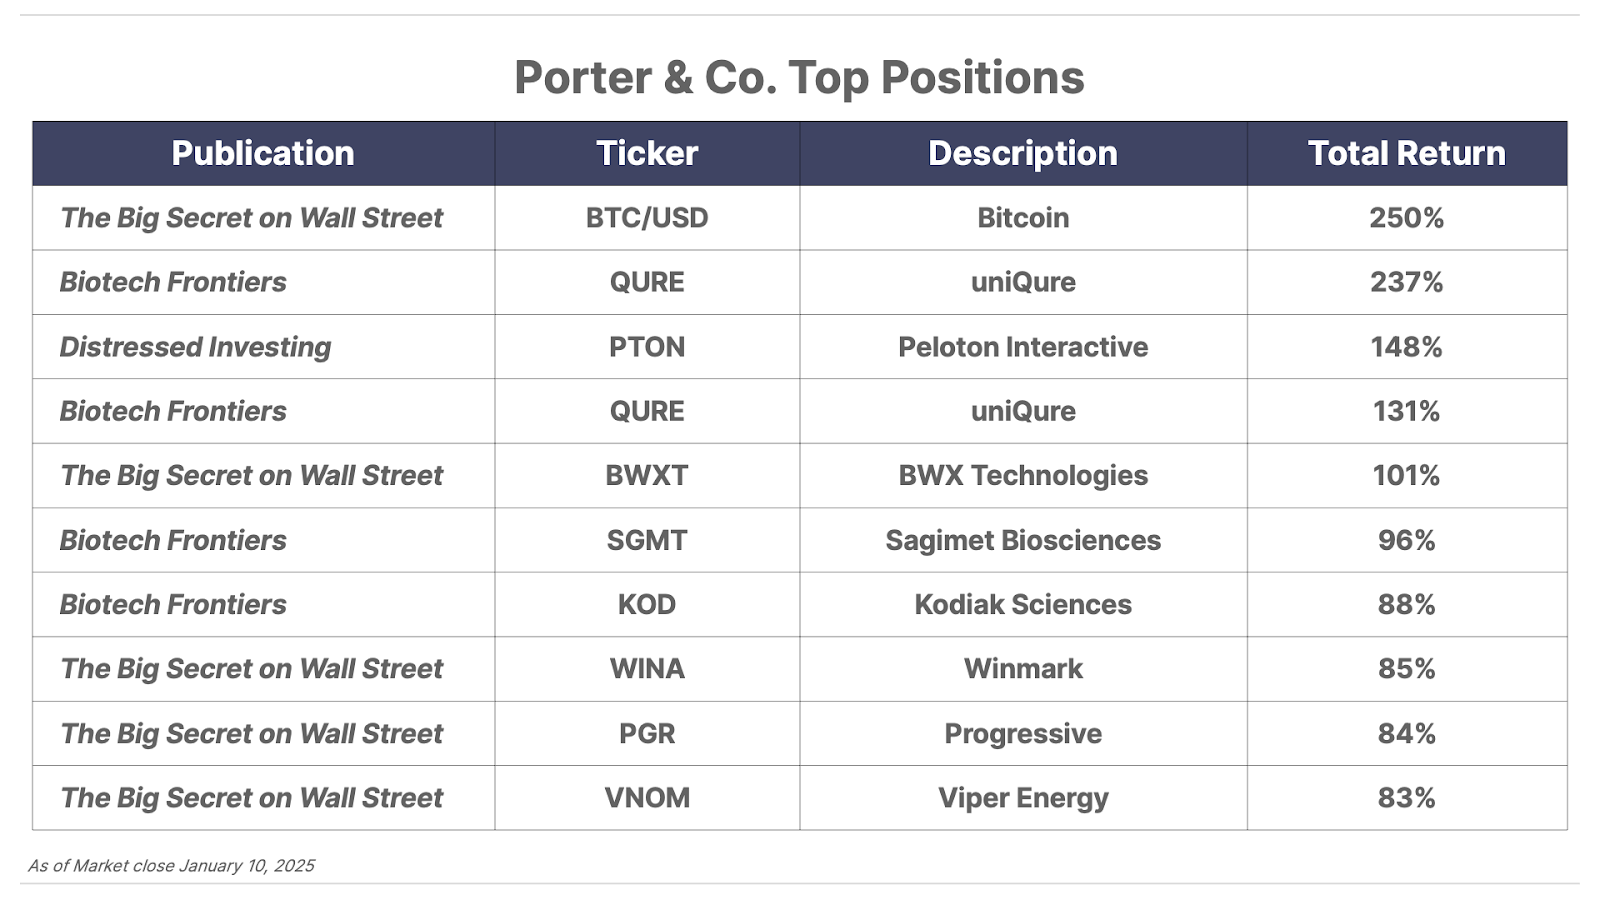
For the fourth time in Distressed Investing, senior analyst Marty Fridson has recommended shares of a company whose distressed bond has risen sharply… All three previous recommendations are performing well, with shares of one up 150%.
Though the macroeconomic environment is challenging for biotech stocks, lead analyst Erez Kalir continues to find compelling ideas for Biotech Frontiers – this month recommending shares of an innovative company developing spare parts for humans.
In The Big Secret on Wall Street, we looked at the enormous disparity in the performance of the price of gold (up more than 100% since 2009) compared to shares of gold mining stocks (down 56%).
And this Thursday, in The Big Secret we’ll release our first recommendation of the year… a capital efficient company whose years of building the business have begun to pay off, soon sending shares higher… If you are not yet a Big Secret subscriber, click here to get in before we release the report on Thursday.
A Lost Decade
It Will Take 10 Years To Rebound
Unless you know for certain that you can hold your investments, without fail, for the next decade at least, it’s time to sell… many of today’s top tech stocks will develop incredible products and grow revenue and profits substantially into the future. But… the cheapest of these high-quality businesses is trading at 25 years’ worth of profits. Most of this success has already been “priced in.”
I’m not saying stocks are going to crash tomorrow. But I think it’s very foolish to believe that stocks, on average, are likely to do well over the next decade.”
To explain further…
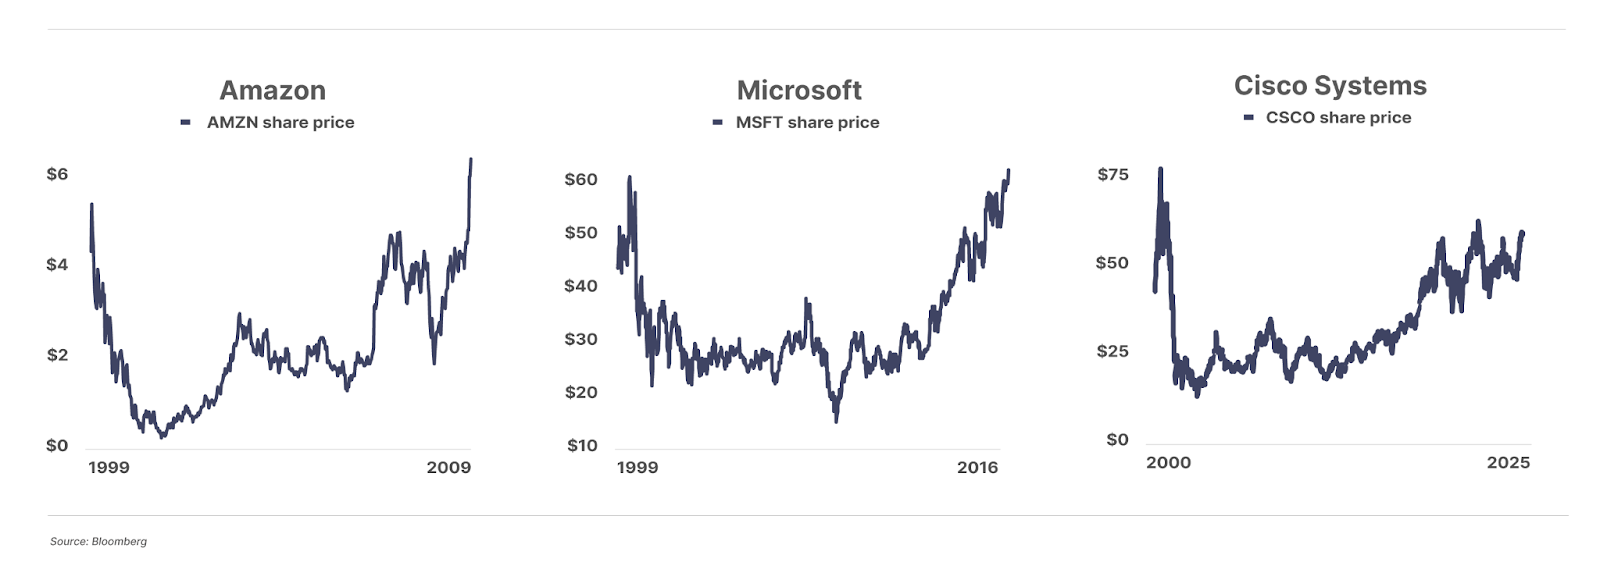
I believe we are at a multi-decade, perhaps even century-high, average level of equity prices. As such, I think it will take at least a decade for many of today’s S&P 500 members to “grow” into their current valuations. Consider, for example, the shares of Amazon (AMZN), Cisco Systems (CSCO), and Microsoft (MSFT) from the year 2000. The internet did indeed change the world. And those firms did indeed build virtually all of the critical infrastructure of the “new railroad.”
But, purchased at their peaks in early 2000, those stocks didn’t earn a dime for investors for years. Amazon’s share price didn’t recapture its 1999 peak until 2009… it took Microsoft 17 years to reclaim its 1999 highs… and today, Cisco shares are still 26% below their 2000 peak. That’s 25 years ago!
You should also remember that there are thousands of equities that trade on the various exchanges in the U.S. Not all of them are overvalued. In fact, as I pointed out, there are many businesses now out of favor that seem relatively attractive for investment.
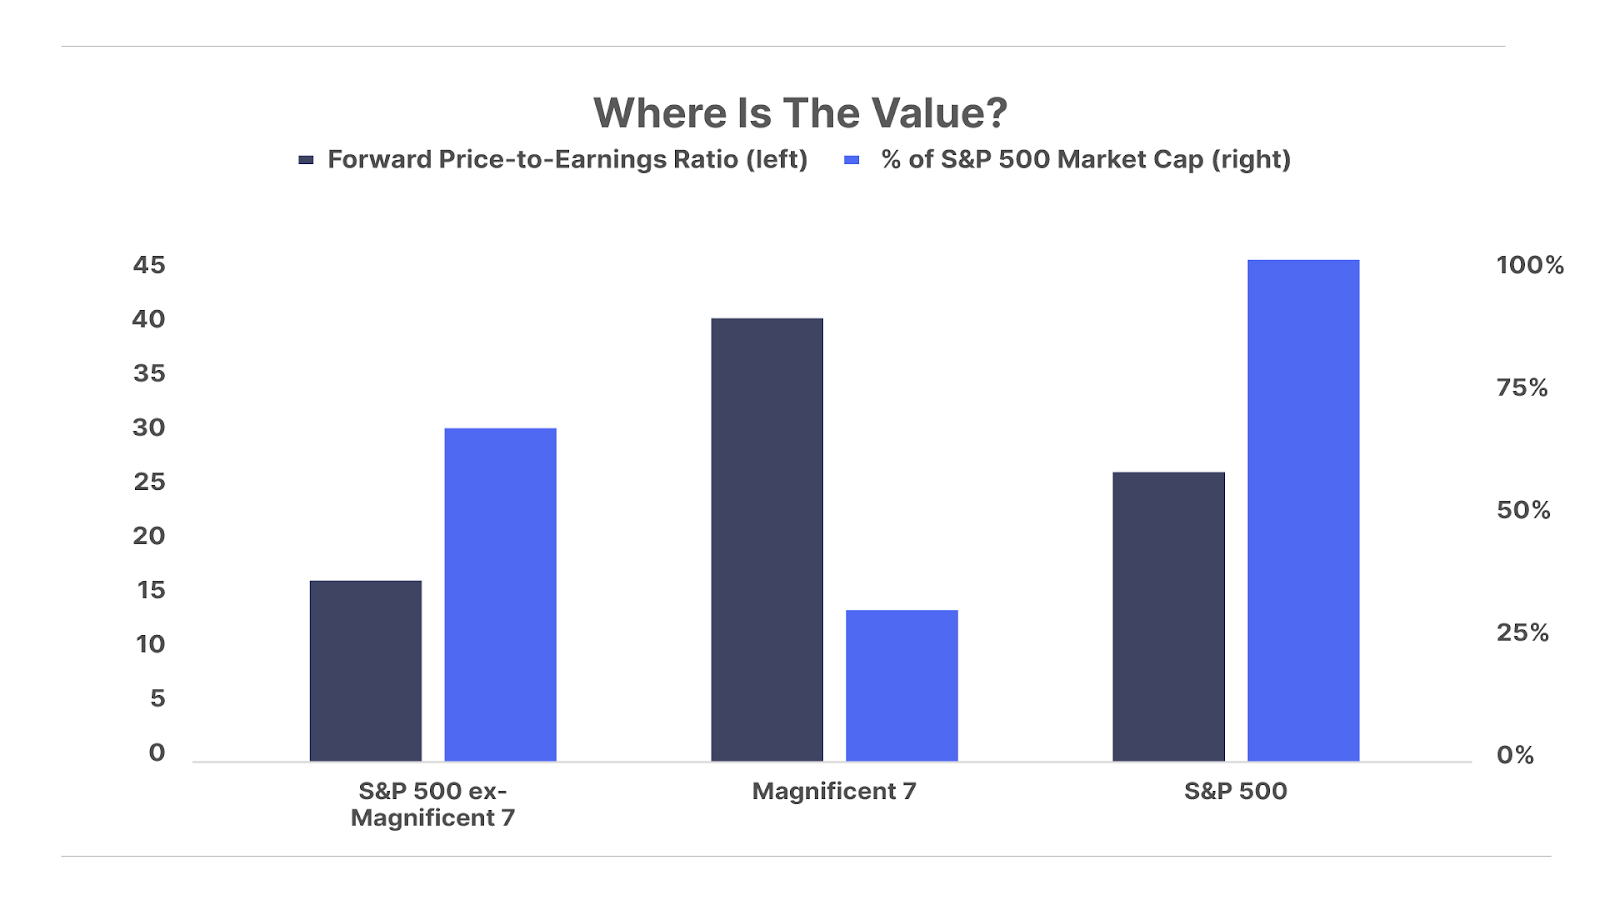
Nevertheless, because so much capital is now being invested “automatically” in S&P 500 index funds and because so much of that index is now crowded into so few stocks and because those “Magnificent 7” stocks are very richly valued, a reasonable correction to those stocks’ multiples could easily trigger a panic that impacts all stocks, even those that are reasonably valued.
Right now, the Magnificent 7 account for 33% of the S&P 500 (that’s an historically unprecedented level of concentration of the biggest stocks). They trade at an average forward price-to-earnings ratio of 40. And the other 493 stocks in the index? They’re a relative bargain at a P/E of 17.
A sharp decline is likely not only because of the valuation issue, but also because I expect interest rates to continue to rise. I do not believe the government will be able to cut spending. And I think inflation is going to continue to increase to levels we haven’t seen since the 1970s.
But, whether I’m right or wrong about that, I believe the odds that stocks will continue to increase at 20% a year are very close to zero. And, the odds that, at some point in the next 10 years, stocks become vastly less expensive is pretty close to 100%.
So, I’m very confident in this prediction. But, I do not have a crystal ball. I can’t tell you when. Nor can I tell you how high those stocks might go from here before they correct.
What I can tell you is what Warren Buffett did the last time the stock market was this overpriced: he raised a huge amount of cash by selling 21% of Berkshire Hathaway (!).
Let me tell you the story in some detail:
Buffett bought General Re in December 1998. The deal closed in March 1999 – about one year before the market’s ultimate peak, at 44x CAPE ratio. (CAPE is the Cyclically Adjusted Price-to-Earnings ratio of the S&P 500… it compares the market value of every stock in the S&P 500 to the net income of those businesses, on average, and adjusted for inflation, over the previous 10 years.)
At the time, General Re was the largest property & casualty insurance business in the U.S. and the third largest in the world.
Buffett spent 272,200 shares of Berkshire to finance the transaction, which was 21% of Berkshire at the time. The deal valued General Re at $23.5 billion. This was the largest deal Berkshire has ever done (as a percentage of its market capitalization). Buffett’s largest-ever insurance acquisition prior to General Re was buying the rest of GEICO (49%) he didn’t own. That was a $2.3 billion deal, in 1996. The General Re deal was 10x larger! In fact, General Re was an even bigger transaction than Buffett’s purchase of BNSF Railway 10 years later ($22.5 billion), by which point Berkshire was much, much larger.
In other words, this isn’t any ordinary deal. This was a freakin’ Hail Mary. This was a financial mayday call.
Why would he do this deal?
Because General Re held $24 billion in cash and securities, including its insurance “float.”
Insurance “float” are funds that are held in trust for the payment of insurance claims. You can think of this capital as being akin to bank deposits. The insurance company doesn’t own these funds, but it is allowed to keep all of the proceeds from investing these funds. And, assuming good underwriting, these funds will continue to grow, which means, they become a de-facto asset of the business, even if they’re not a legal asset of the business.
Buffett specifically made sure that General Re brought over only cash: he had the company sell its entire $20 billion equity portfolio (about 250 stocks!), which generated capital gains taxes of $1 billion. Buffett was buying cash (and short-duration fixed income.) And paying 21% of his company for it!
He was hedging his entire portfolio, without having to sell any of the stocks in his portfolio. (He did sell one stock – it was a terrible mistake – but he didn’t have to sell any.)
After the merger:
- Berkshire had a net worth of $57.4 billion
- Its portfolio of common stocks was valued at $37 billion
- It held $15 billion in cash directly, plus another $22 billion in cash “float”
Buying General Re, with stock, had the impact of increasing the amount of cash Berkshire controlled as a percentage of its equity portfolio to around 60%.
So, to summarize, the last time stocks were this expensive, Buffett altered his allocation substantially by adding around $20 billion in cash against $37 billion of equities.
He did so in a very clever way.
Perhaps there’s a way for you to raise more cash too.
Or, you could simply move 60% of your portfolio into very well-run insurance stocks, like W.R. Berkley (WRB). That would probably produce a similar increase in the amount of fixed income you hold, indirectly. (Insurance companies are generally valued by the size of their fixed income holdings, including float.)
(Insurance stocks should be a foundation of every investor’s portfolio. We’ve put together a primer on the property & casualty insurance sector… along with reports on some of the strongest insurance companies in the world. You can learn more about it here.)
What stock did Buffett sell? McDonald’s (MCD)! What a huge mistake!
Buffett knew it, and wrote about this mistake later: “… my decision to sell McDonald’s was a very big mistake. Overall, you would have been better off last year if I had regularly snuck off to the movies during market hours.”
Let me know what you think by sending comments to [email protected]
Regards,
Good investing,
Porter Stansberry
Stevenson, MD
