Issue #115, Volume #2


Everyone Wants To Buy It… And No One Wants To Sell
This is Porter’s Daily Journal, a free e-letter from Porter & Co. that provides unfiltered insights on markets, the economy, and life to help readers become better investors. It includes weekday editions and two weekend editions… and is free to all subscribers.
| Nearing $4,000 per ounce… Central banks are hoarding it… Silver comes close to rivaling gold… Gold is the new global safe haven asset… Crypto inflows hitting record highs… Shipping index continues to plummet… |
Gold is approaching $4,000 per ounce and has rallied more than 50% year to date.
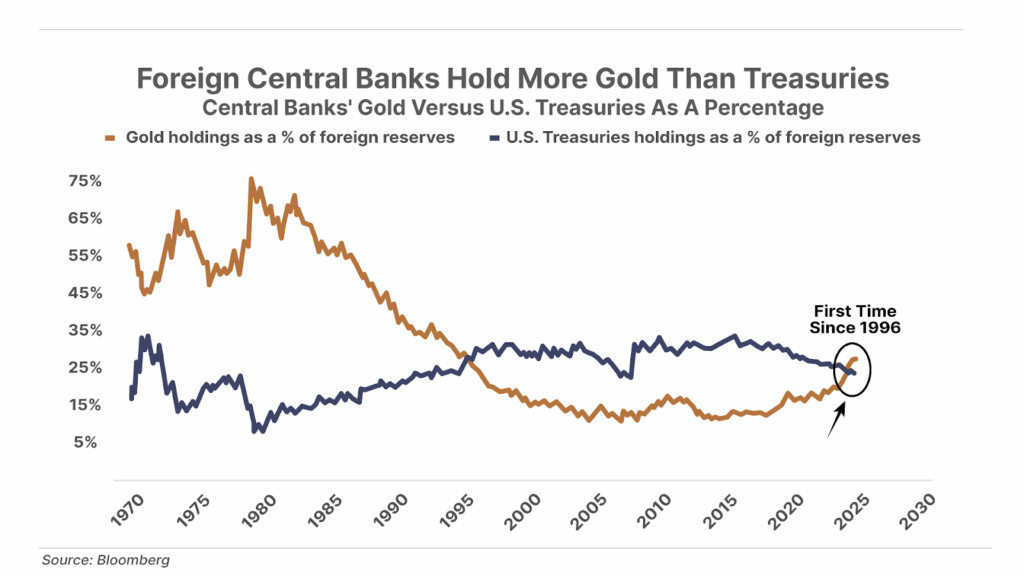
As we have reported regularly in the Daily Journal, for the first time in nearly 30 years, foreign central banks hold more gold than U.S. Treasury debt as a percentage of reserves. As the chart below highlights, this shift from Treasuries to gold began roughly 10 years ago, and accelerated after the U.S. seized Russia’s reserves following the start of the war with Ukraine. If gold is resuming its role as the world’s preferred reserve asset, history suggests it has much further to run.
We have written about the true value of gold – and why gold continues to win – in past Big Secret On Wall Street issues.
Historically, most monetary goods – including gold – were relatively difficult or energy-intensive to obtain at the time of their adoption.
However, gold’s physical durability is unique. The metal is so chemically stable that it is virtually impossible to destroy. And unlike many other commodities, only a relatively small proportion (about 3%) of gold production is consumed in industrial uses.
This combination of traits means most of the gold that has ever been mined is still owned today, giving it an extremely high stock compared to other monetary goods.
This vast and ever-growing existing stock means producers can only “inflate” the gold supply by an average of around 1.5% a year, despite ongoing technological improvements that make mining ever more efficient. And this figure has been remarkably stable over time, regardless of fluctuations in the price of gold.
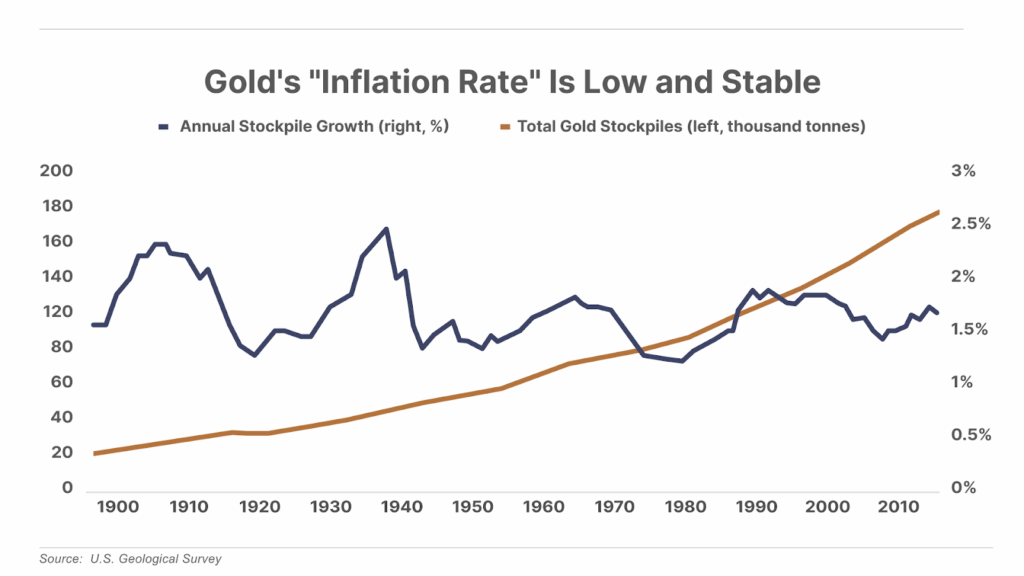
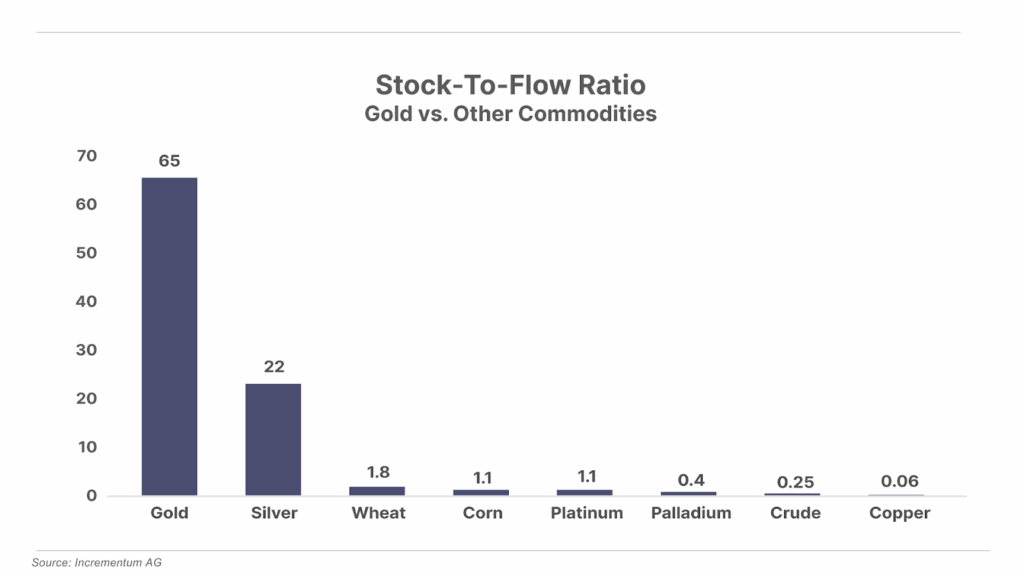
The total amount of existing gold is estimated to be around 200,000 metric tonnes today. At the current annual production rate of around 3,100 metric tonnes, this represents a little more than 65 years’ worth of supply – giving gold a stock-to-flow ratio of around 65.
The stock-to-flow ratio is one of the best ways to assess a particular money’s hardness.
This ratio compares the existing supply (or stock) of a monetary good – which includes all that has been produced in the past, less any amount that has been consumed or destroyed – to how much new supply (or flow) can be produced in a given period (typically a year).
The higher the stock-to-flow ratio, the harder the money and the more likely it is to maintain its value over time.
This dynamic implies that the hardest money – and the best store of value – would be one that not only has a relatively low flow, but also a relatively high stock. When viewed through this lens, gold’s advantage over other historical forms of money becomes clear.
The stock-to-flow ratio for fiat currencies is theoretically zero, as there is technically no limit to how much new currency can be created. In practice, the U.S. money supply has increased by about 10% annually since the dollar was officially severed from gold in 1971. That equates to a stock-to-flow ratio of roughly 10, though this number is likely to plummet in the years ahead as the government has no choice but to paper over its soaring debts.
By comparison, the stock-to-flow ratio for most commodities other than gold and silver is generally around one, indicating that new production roughly equals or exceeds existing global stocks that are constantly being consumed.
When savers choose to store their wealth in one of these “easy” forms of money, a predictable cycle emerges.
First, the increased demand for the commodity causes the value of the money to rise… Rising prices then incentivize producers to invest in increased production… This increased production then greatly expands the supply of the commodity… And finally, soaring supply causes the value of the money to crash – effectively transferring the wealth of those savers to the producers of the commodity they bought.
This was exactly what happened to early savers who continued to hold their wealth in primitive monies like salt or seashells, after technology caused their stock-to-flow ratios to plummet. And a similar dynamic has impoverished countless others who saved in modern fiat currencies in the centuries since.
But gold’s unique properties make it immune to this cycle.
Because so much gold already exists, even if new gold production were to double overnight, it would result in only a 3% annual increase in total supply. Meanwhile, the simultaneous growth in gold’s existing stock would make each additional annual increase less significant, even if that rate of production is maintained.
In other words, unlike most other monetary goods, it is practically impossible to create enough new supply to suppress the price of gold significantly.
Among commodities, only silver comes close to rivaling gold. Its stock-to-flow ratio is around 22 – indicating one-third the hardness of gold.
Silver is “easier” money than gold for two important reasons. First, silver is significantly less rare and easier to refine – giving it a higher flow than gold. Second, silver is less chemically stable than gold (it can corrode) and significant quantities are consumed in industry. The metal plays a critical role in a huge number of products including batteries, nuclear reactors, semiconductors, touch screens, and water purification – meaning its existing stock is much lower than the existing stock of gold.
Despite these drawbacks, silver was used as money alongside gold for thousands of years – its lower value per unit of weight made it more convenient for smaller transactions. However, the widespread adoption of the gold standard in the late 19th century enabled gold-backed paper transactions that eliminated this need, ultimately causing silver to lose its monetary role.
And as Trading Club analyst Ross Hendricks pointed out in a trade alert sent to club members last month: Our reason for owning precious metals is based on the same basic ideas Porter has written about for the last 15 years, most famously in his End Of America thesis – the runaway train of America’s debt and deficits is leading to the eventual insolvency of the U.S. federal government.
With U.S. federal debt now exceeding 130% of GDP, and Uncle Sam’s $1 trillion-plus annual interest bill surpassing the entire U.S. military budget, America’s descent into insolvency is rapidly accelerating.
The smart money has been preparing for this outcome for years. Starting in 2020, global central banks began dumping U.S. Treasuries in favor of gold.
And even though gold now makes up a larger portion of foreign central bank reserves than U.S. government bonds, this trend still has a long way to go. Gold only makes up around 25% of total international reserves. Prior to the Bretton Woods agreement that cemented the U.S. dollar at the heart of the global financial system, this number was over 70%.
We believe we’re in the early stages of a reset in the post-World War II global monetary order, in which hard money – like gold – ultimately replaces the U.S. dollar and U.S. Treasuries as the bedrock of the international monetary system. This trend began after the 2020 COVID money-printing spree, best shown in the chart below where Treasury bonds collapsed as gold soared in value:
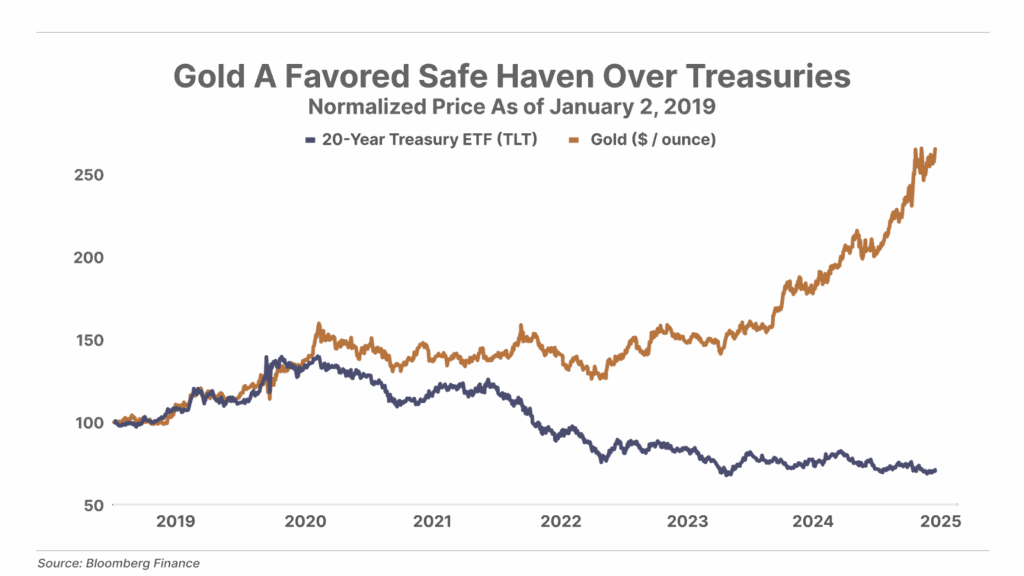
Instead of buying into government bonds as the safe haven asset, global investors are piling into gold, which broke out to record highs above $2,100 per ounce in March 2024, and has since rallied another 80% to nearly $4,000. The message from the market is clear: gold is the new global safe haven asset, as investors flee into it and away from the promissory notes of overly indebted governments around the world.
‘The Biggest Breakthrough In The History Of Our Firm’

Joel Litman has attracted an elite roster of private clients that includes the top 10 global investment houses and more than half of the world’s 300 biggest money managers. And yet, he says this strange moneymaking phenomenon could be the biggest breakthrough in the history of his firm. His historical study shows 99 individual 100%-plus winners since the COVID-19 bull run. And based on 35 years of data, you can expect an average stock gain of 163% any time it happens.
Click here to learn more now.
Three Things To Know Before We Go…
1. The AI boom just got even frothier. This morning, OpenAI announced a major deal with Advanced Micro Devices (AMD) to purchase its latest chips, with AMD offering warrants for up to 10% of its stock. Powering the new hardware will require about 6 gigawatts of electricity – roughly equal to Singapore’s average demand. At an estimated $50 billion per gigawatt, the build-out could top $300 billion. The deal follows Nvidia’s (NVDA) $100 billion equity stake in OpenAI, and OpenAI’s $300 billion commitment with Oracle (ORCL), underscoring how the artificial intelligence buildout is beginning to resemble the internet bubble. AMD shares jumped 35% in pre-market trading.
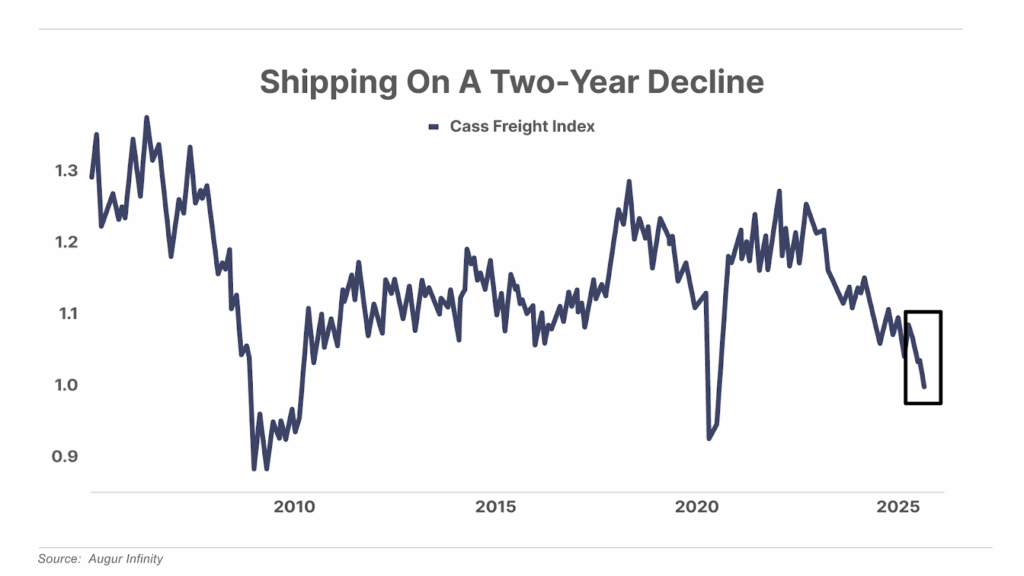
2. The transportation sector slips into recession. The Cass Freight Index, which measures activity in North American shipping and logistics, dropped 9% year-on-year in August. This marked the 28th consecutive monthly decline in the index, which now hovers at levels last seen during prior recessions in 2020 and 2008.
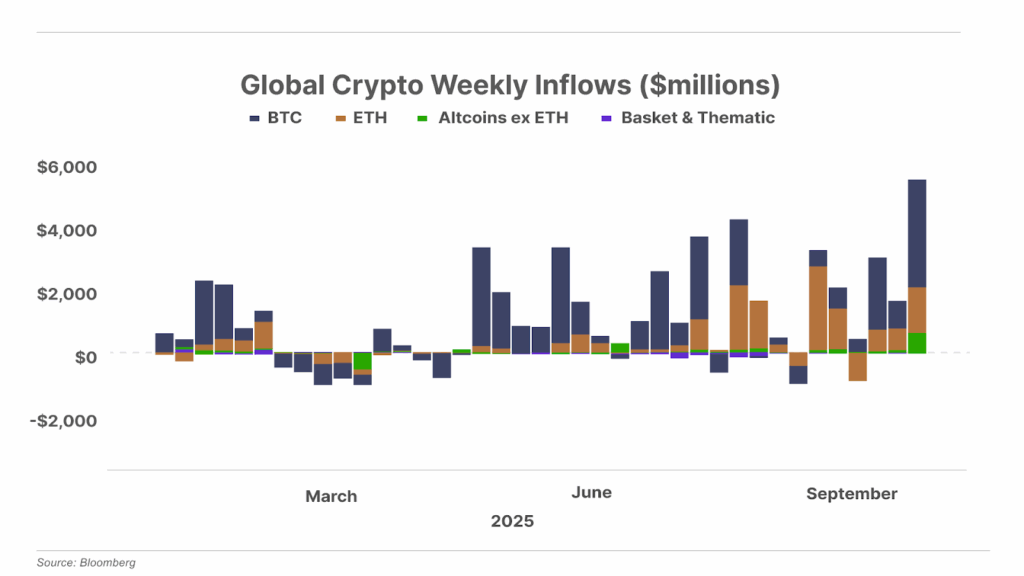
3. Investors are fleeing into Bitcoin, too. Gold and silver aren’t the only assets benefitting from the accelerating flight from fiat currencies. Global crypto exchange-traded products (“ETPs”) experienced a record $5.7 billion in inflows last week… with the vast majority of those funds going into Bitcoin, aka “digital gold.”
And One More Thing… When Will The Government Shutdown End?
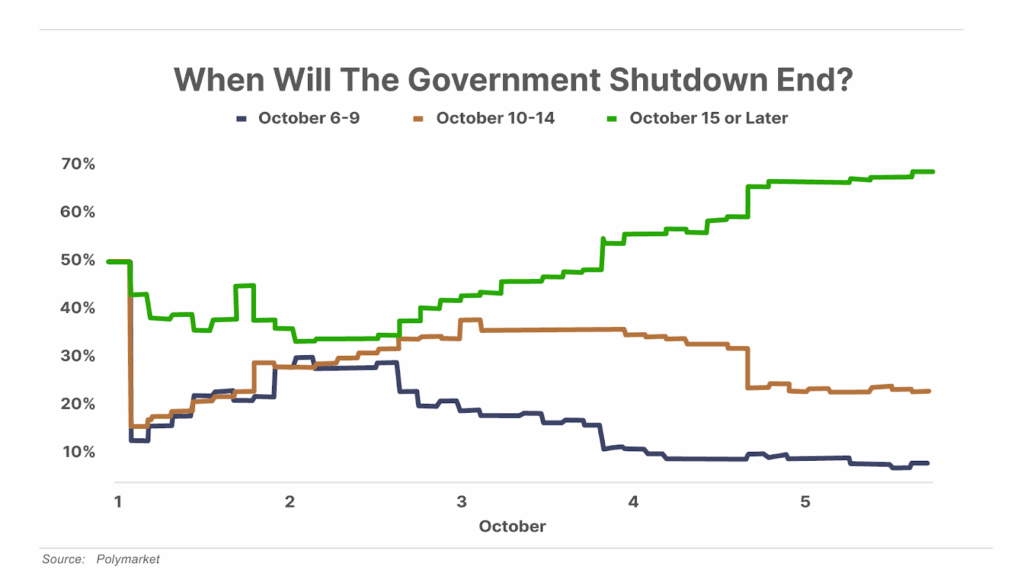
Don’t hold your breath waiting on a quick resolution to the U.S. government shutdown. According to Polymarket, the world’s largest prediction market, the shutdown is likely to continue for at least another 10 days. Fortunately, as we noted last week, the market tends to shrug off these events… with the S&P 500 showing an average gain of 12.7% over the 12 months following a shutdown, with positive returns 86% of the time.
Tell me what you think of this Daily Journal: [email protected]
Mailbag
In Friday’s Daily Journal, Porter reported that investors are in the midst of unlocking so much value from Japanese businesses that making something like 25x your money in this market over the next decade is almost inevitable. He specifically probed into the details of one promising company called SBI Holdings, which trades on the Tokyo Stock Exchange, and which Erez Kalir had recommended in Tech Frontiers in February (it’s up 50% since then).
Readers shared their thoughts…
You just gave away for free the company I paid to get in Tech Frontiers. What’s with that?
Michael S.”
Porter’s response: Maybe you can tell me what’s wrong with me telling 100,000-plus investors about a stock you already own?
Excellent article, Porter.
I hope in the future you cover more of the crypto world because it looks like the future of finance.
Jim O.”
If you think this investment idea sounds good, wait until you see what Porter has in store in our next issue of The Big Secret On Wall Street – on Thursday of this week. It’s the largest opportunity in Japan… and it’s worth 5x to 10x its current market cap. Oh, it’s also the safest investment he’s ever seen.
If you’re not yet a paid-up subscriber to The Big Secret On Wall Street, click here now to learn more.
Good investing,
Porter Stansberry
Stevenson, Maryland
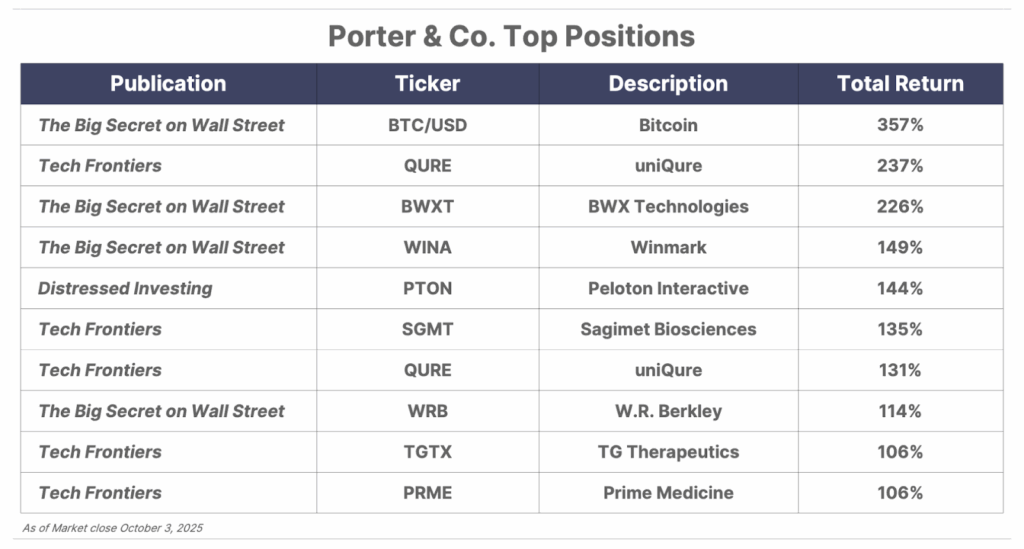
Please note: The investments in our “Porter & Co. Top Positions” should not be considered current recommendations. These positions are the best performers across our publications – and the securities listed may (or may not) be above the current buy-up-to price. To learn more, visit the current portfolio page of the relevant service, here. To gain access or to learn more about our current portfolios, call our Customer Care team at 888-610-8895 or internationally at +1 443-815-4447.