Issue #109, Volume #2


How I Know Exactly What Gold Will Be Worth
This is Porter’s Daily Journal, a free e-letter from Porter & Co. that provides unfiltered insights on markets, the economy, and life to help readers become better investors. It includes weekday editions and two weekend editions… and is free to all subscribers.
| The oldest secret in the world… Here’s the formula… Warburgs, Rothschilds, Medicis all knew it… The key is understanding the lag… Credit is at an all-time high… Rent outpaces income… A reader poll… |
I’ve been buying gold since the early 2000s.
Back then, it wasn’t hard to figure out that gold was cheap. Central banks were selling. At under $300 per ounce, the price was less than 50% of its previous peak, 20 years earlier. And the “ducks” were “quacking” for tech stocks, not gold. I remember posting on George Gilder’s Gilder Technologies message board that gold would outperform stocks for at least a decade in the early 2000s.
Lucky guess? Perhaps.
But, I also put most of my liquid net worth into gold in the fall of 2008, when it traded below $800 for a brief period. In 2015, when gold stocks hit their lowest valuations of all time, I published my only research report (ever) about gold stocks. And, last year, once again, I put about 50% of liquid assets into gold stocks and Bitcoin.
Just lucky guesses? Maybe.
But I’ve also never sold any of my gold – not a single coin.
How did I know…? How did I know that those were great times to buy gold and how did I know gold would continue to compound?
Understanding the gold price – being able to predict it accurately – is one of the oldest and most valuable secrets in the world.
For centuries, this knowledge was hidden because the data required to calculate the gold price (global credit growth) was a secret. By aggregating this data, and keeping it secret, the world’s most powerful bankers (the Medicis, the Rothschilds, the Warburgs, the Morgans, etc.) could accurately predict future asset prices, such as real estate and commodities, currency exchange rates, and, most importantly, gold.
The ability to consistently predict market prices gave them nearly unlimited economic power and wealth. And spawned a never-ending series of conspiracy theories trying to explain their enormous power.
Kurt Richebacher, one of the last living original Austrian school economists (Kurt died in 2007) taught me the secrets behind these algorithms after we met and became friends in 1998. Kurt called me “the Young Radical” and loved arguing with me about the impact of internet technologies. He told me I was the only young person he’d ever met who could quote Murray Rothbard. I spent hours explaining to Kurt how things like Qualcomm’s spread spectrum CDMA technology was the beginning of the entire move toward parallelism in technology, a move that continues today with Nvidia’s massive parallel-computer systems.
And Kurt spent hours teaching me the ancient secrets of the Adlers, which I wrote about a couple of weeks ago.
I doubt there were any money managers in the U.S. who would have put 25% of their client accounts into gold and Bitcoin a year ago, like I did with my recommended allocations in Porter’s Permanent Portfolio. But I was even more aggressive with my personal account. Levered 2x, I put about half of my equity into gold – via shares of Franco-Nevada (FNV) – and Bitcoin.
Today my holdings of Franco-Nevada are the primary reason my personal brokerage account is up more than 100% so far this year.
So how did I know to buy gold in 2002? How did I know to buy gold in 2008? How did I know to buy gold in 2015? How did I know that gold would continue to perform strongly this year? How was I sure enough about the price to leverage so heavily into gold?
I knew exactly what the price of gold would be by the end of this year. And next year too.
Here’s the ancient formula:
log(Gold Price_t) = α + ∑(i=1 to n) β_i * Credit Growth_t-i + γ_1 * Inflation_t + γ_2 * Real Rate_t + γ_3 * Dollar Index_t + ϵ_t
Using the natural logarithm of gold’s price transforms it into a scale where percentage changes (rather than absolute changes) are emphasized, which is useful for analyzing assets like gold that experience exponential growth over time. The key variables in the formula are fairly intuitive (credit growth, inflation, real interest rates, and the dollar’s exchange value), but there’s one real secret to using this formula: understanding how to lag the sum of these effects. The most accurate lag period is three years.
In addition to understanding the lag period, the key to the algorithm is knowing total, global credit growth.
When credit booms, like it did in the late 1990s and like it did during the mortgage boom in 2005 and 2006, it increases inflation and generates increasing economic stability risk.
Thus credit drives gold prices higher – with a lag.
The algorithm creates a range of gold’s price in three years’ time. Here’s the predicted range of the actual price of gold (in January) since 1980.
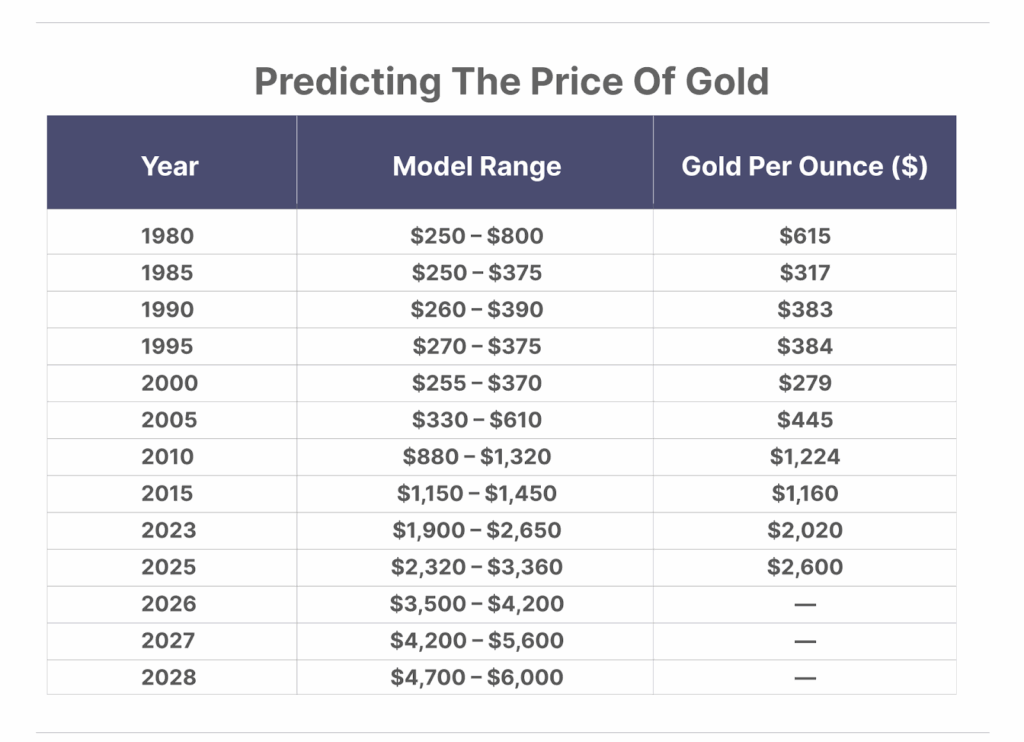
By the end of next year (2026), gold will be above $4,000 per ounce. And by the end of 2027, gold will be above $4,700… and perhaps around $6,000.
Thus, at the start of this year, I knew that gold would, mostly likely, double over the next three years. And I knew it wouldn’t go lower. It’s easy to push your chips into the pot when you know you’ve got winning cards.
The model excels at anticipating multi-year regime shifts (late 1970s, 2006-2012, 2020-present). The model has been as bullish as I’ve ever seen it because the current credit-creation supercycle is the largest the world has ever seen.
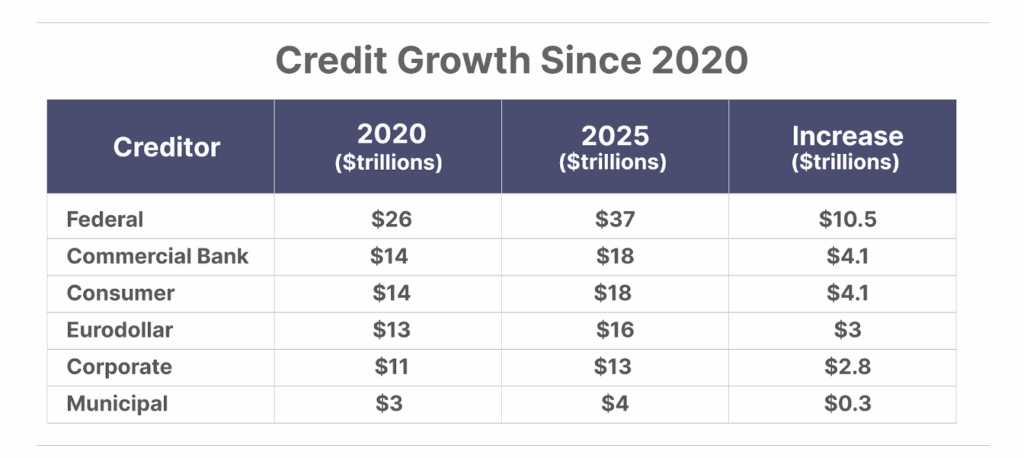
In just the last five years, we’ve generated almost 100% of GDP worth of additional credit. In 2020, U.S. GDP was $21 trillion. And today, total non-financial credit outstanding is about 245% of GDP, which is all-time high.
The rate cuts we saw last week will propel this enormous credit bubble to even higher levels. Historically, a one-percentage-point reduction in short-term rates will boost lending by roughly 1.5% within a year, as the cost of funding drops while lending returns remain stable or rise.
The current credit-to-GDP ratio (245%) is notably above prior bubble-era levels, indicating unprecedented system leverage relative to economic output. This will not end well for most investors.
Hedging with gold will be the key to survival.
Horse, meet water.
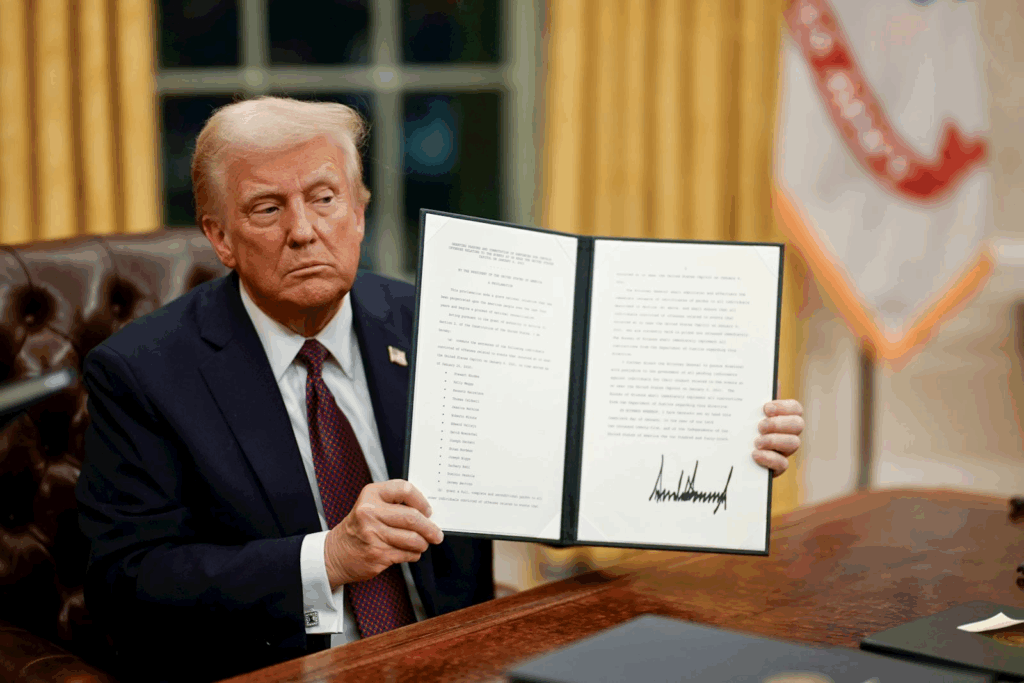
Trump to Open ‘Phase II’ of The American Birthright?
President Trump has made a move to permanently open the floodgates of America’s mineral dominance, unleashing Phase II of the American Birthright.
Historically, Phase II has been the most lucrative investing window across resource booms. The last time this happened, investors could’ve seen rare peak returns of 7,500%… 20,183%…even 140,000% in the span of 3 years.
Trump is just days away from opening a new Phase II window. To know exactly what to do, get the complete Phase II strategy immediately HERE.
Three Things To Know Before We Go…
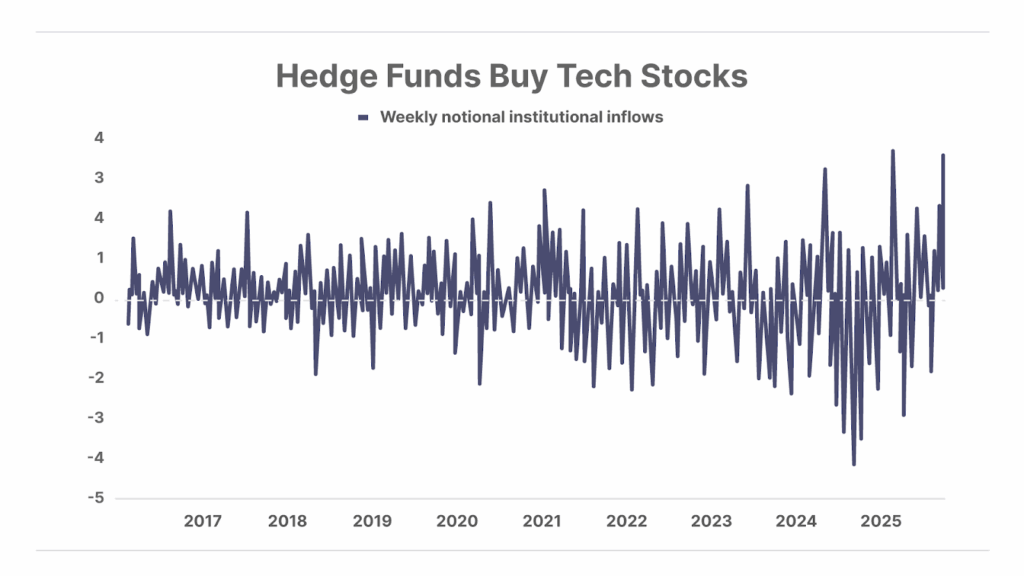
1. Investors go on a buying spree. Data from Goldman Sachs shows that hedge funds bought over $3 billion in technology stocks last week, the second largest amount ever. Meanwhile, retail traders also posted the largest inflows of the year into the stock market last week. Enthusiasm to buy stocks is running rampant.
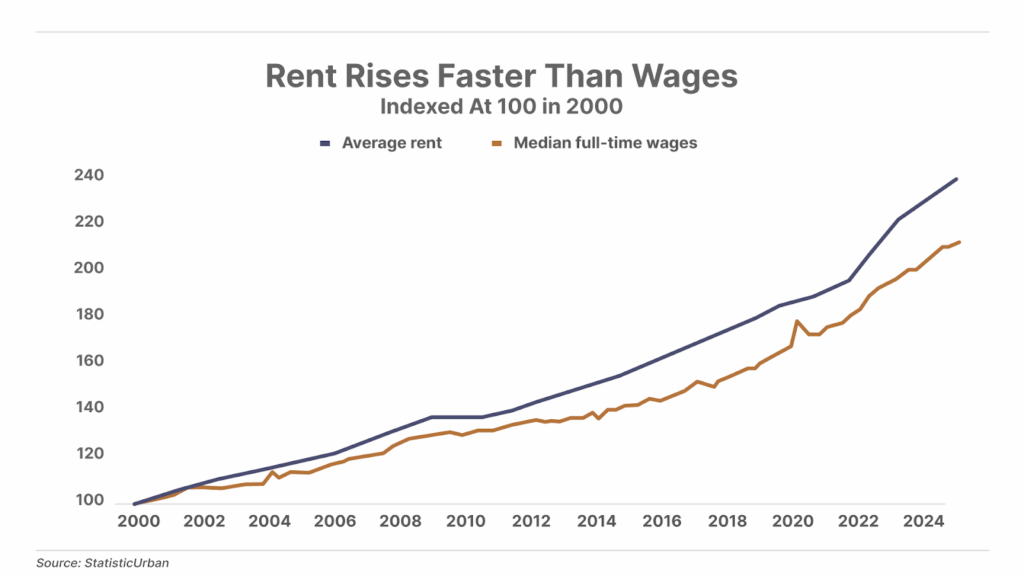
2. Living costs outpace wages. Since 2000, average rents have surged 139%, while median full-time wages have risen only 112%. Housing affordability has eroded too – household incomes would need to climb 60% to return to the 2016 to 2019 affordability range. As long as currency devaluation persists, rising housing costs are likely to stay.
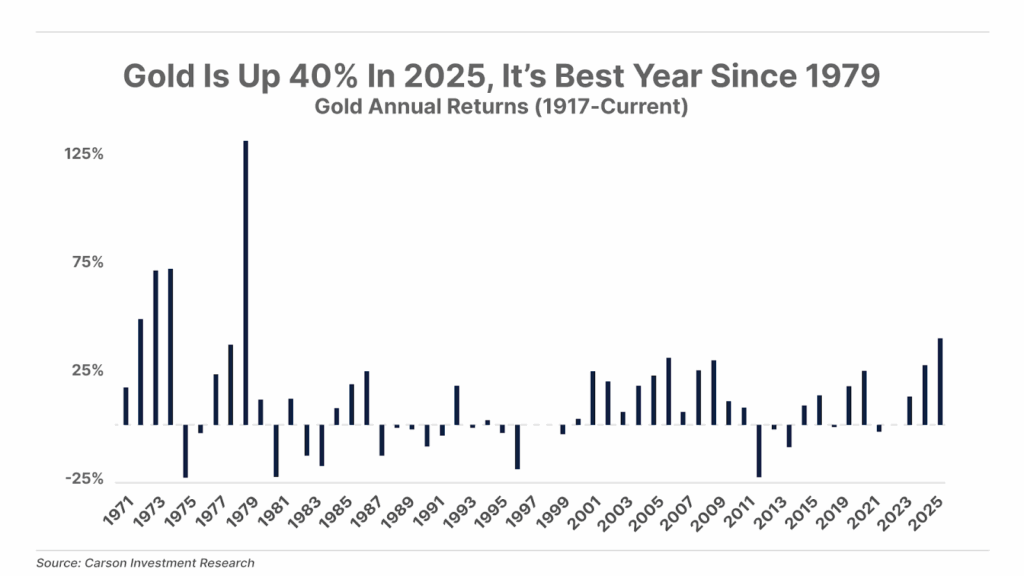
3. Gold keeps climbing and climbing. As detailed above, this year has been historic for the hard asset, marking its strongest rally since 1979 – when inflation hit as high as 13.9%. But while 2025’s year-to-date 40% rise is impressive, it pales in comparison to 1979’s 133% surge. In the 1970s, gold delivered annual returns above 35% in five separate years, and topped 70% three times. If the 2020s echo that era – and we see another prolonged bout of inflation – then double-digit gains in gold may become the new norm.
And One More Thing… Poll: The Price Of Gold
We wrote above about the recent gold rally, with the price soaring above $3,700 per ounce for the first time – and up 40% for the year. Many think there is room to grow, while others say gold has reached its peak… Tell us what you think.
Tell me what you think: [email protected]
Good investing,
Porter Stansberry
Stevenson, Maryland
Please note: The investments in our “Porter & Co. Top Positions” should not be considered current recommendations. These positions are the best performers across our publications – and the securities listed may (or may not) be above the current buy-up-to price. To learn more, visit the current portfolio page of the relevant service, here. To gain access or to learn more about our current portfolios, call our Customer Care team at 888-610-8895 or internationally at +1 443-815-4447.