Issue #36, Volume #2


The Ponzi Scheme That Will Destroy The Dollar
This is Porter’s Daily Journal, a free e-letter from Porter & Co. that provides unfiltered insights on markets, the economy, and life to help readers become better investors. It includes weekday editions and two weekend editions… and is free to all subscribers.
| Elon Musk will not be able to cut government spending… Mortgage lending disparities created massive financial losses… Social Security cannot be saved this decade… Expectations for GDP drop again… |
Before you read today’s Daily Journal I’d like to offer a prediction about your reaction to the facts I outline below.
More than half of you will be very offended.
I expect at least 1,000 subscribers will cancel as a result. Some of you will also call me a racist. But a small number of you will recognize that everything I’ve written below is true, and that our country is in the midst of a once-in-a-hundred-years financial collapse.
And that’s why I’ve written this: to give everyone a fair warning about what is going to happen as President Donald Trump’s tariffs begin to reshape the world’s markets.
I’ll also explain why Elon Musk, who heads up the Department of Government Efficiency, will not be able to reduce government spending – ever.
At the heart of this problem is an unpleasant fact. In our democracy there’s a huge incentive for people to vote for benefits (money, credit, patronage) they do not have to pay for themselves. These incentives create huge inefficiencies in our economy (especially in our financial system and in government spending).
And those inefficiencies over many years have led to a debt spiral that will collapse in the next four years.
Trump and Musk can’t save us. And, ironically, their efforts will trigger the final collapse of the U.S.-dollar-based global financial system.
To fully explain why, let me show you how our government destroyed $500 billion directly and trillions indirectly two decades ago.
In 1992, the Federal Reserve of Boston published a damning report, “Mortgage Lending in Boston: Interpreting HMDA Data” (HMDA is the Home Mortgage Disclosure Act).
This report alleged minorities were rejected from mortgages 2.7x times more often than white people, even when applications were equalized for factors other than race.
The study was so shocking it led to sweeping new laws and regulations designed to force banks to extend credit to minorities, including rewriting the 1977 Community Reinvestment Act to force banks to extend loans to minorities.
Among the most important new pieces of legislation were:
- 1992 Federal Housing Enterprises Financial Safety and Soundness Act (set affordable housing goals for Fannie Mae and Freddie Mac) requiring them to buy a percentage of mortgages from minority borrowers
- 1995 CRA (Community Reinvestment Act) Amendments, which assigned points for lending in minority neighborhoods and thus setting up a way to score banks’ minority lending
- And, finally, in 2001, the regulators (HUD) raised Fannie Mae’s and Freddie Mac’s minority lending requirements to 50% of their mortgage purchases!
Increasing minority homeownership was a stated goal of both the Clinton administration and the Bush administration. And government regulations worked to that end. Black homeownership surged from 42% of black households in 1994 to almost 50% by 2004.
But there were good reasons that banks were rejecting minority borrowers.
Many had poor credit and little or no down payment. Some of them didn’t have any verifiable income. As a result, these mortgages were extremely risky. That’s why black mortgage applicants were 3x more likely to require a subprime mortgage than a white borrower.
By 2006, more than half (54%) of all mortgages underwritten to black borrowers were subprime. The Joint Center for Housing Studies reported that black borrowers received 25% of all subprime loans between 2000 and 2008.
And, as any experienced banker could tell you, the longer the real estate boom continued, the lower the quality of the mortgage borrowers would become. As the boom peaked, a substantial percentage of new borrowers were not making even a single payment. By 2005, the 12-month default rate had increased from 1.5% (2000-vintage) to 14.6%. By 2006, the 12-month default rate on subprime was 20.5%.
Who was defaulting? Minority borrowers made up more than half of these “early defaults,” despite only making up about 25% of all subprime loans. A 2011 report from the Center for Responsible Lending found that black borrowers who took out subprime loans between 2004 and 2006 were about 76% more likely to face foreclosure than white borrowers with similar loans. Data from the Urban Institute and the Federal Reserve show cumulative foreclosure rates of 40% for black subprime borrowers, roughly double the rate of white subprime borrowers.
Plus, in addition to vastly higher default rates, there were extreme loss ratios (losses in excess of 80% of the loan value) in some subprime loans. What cohort of subprime loans were the most likely to suffer extreme losses? Loans that had early defaults (less than 12 months of payments) and loans that were in areas of concentrated subprime lending, which were mostly minority, urban neighborhoods.
By 2008, foreclosure rates in predominantly black zip codes were two to three times higher than in white areas. And the loss severity in these neighborhoods were frequently catastrophic.
In Cleveland’s Slavic Village (a heavily minority area), 40% of subprime loans from 2005 to 2006 defaulted within two years, and many homes sat vacant, damaged, or sold at 20% to 30% of the loan value.
In Detroit, a 2015 case (Adkins v. Morgan Stanley) alleged that New Century Financial flooded black neighborhoods with subprime loans, leading to 60% foreclosure rates in some tracts by 2010, with properties often abandoned and unmarketable.
In Baltimore, a 2011 Justice Department settlement with Wells Fargo found 4,500 subprime loans in black neighborhoods, with early default rates topping 50% and losses per loan of $100,000+ due to unsellable homes.
In Chicago, black zip codes saw 30% to 40% of 2006 subprime loans default within 12 months, per Federal Reserve Bank data, with recovery rates as low as 25%.
The collapse of our banking system in 2008 was caused by losses on mortgages, a type of lending that had never seen loan-loss severity of more than 2% (on prime loans) or 5% to 7% (on subprime loans). But the average loss severity on the subprime mortgages that were underwritten between 2000 and 2008 were in excess of 40%.
As a result, the direct losses on mortgages totaled around $500 billion. Most of these losses (roughly $300 billion) came from subprime mortgages. And most of those losses stemmed from loans that almost immediately defaulted (12-month default rate) and that were written on properties where loss severity was in excess of 80% of the loan. These loans were, overwhelmingly, made to minorities.
Most people, even today, still can’t explain why this happened. How were so many people who clearly couldn’t afford their mortgages given loans? How were so many loans written on properties that were obviously in very high-risk areas?
There are two reasons.
The first reason is obvious: Fannie Mae and Freddie Mac were required to buy these loans. And thus, banks were highly incentivized to underwrite them.
Altogether, Fannie Mae and Freddie Mac lost around $285 billion on direct mortgage lending and guarantees. While other financial institutions lost billions more on derivatives, like credit default swaps, no other financial institution lost more, directly on mortgages, than the firms that were required to buy loans from minorities.
The second reason is very poorly understood.
The 1999 bill (Gramm-Leach-Bliley) that rescinded the Glass-Steagall regulations separating investment banking from commercial banking also allowed subprime mortgages to be included in mortgage securities. This regulatory change allowed banks to offload risky loans they knew were vastly more likely to default. And that cleared the way for them to underwrite loans to minorities without retaining those risks.
That explains the “how” these massive losses happened. But the “why” these things happened can all be traced to what I call “the big lie.” How do you convince people in a democracy to demand that obviously stupid policies be adopted? By creating a big lie, and making sure that no one is allowed to argue about it.
Remember how all these changes were driven by that 1992 Federal Reserve of Boston study “proving” rampant racism in mortgage lending? Well, there was one small problem. The report was nonsense. It was completely made up.
In 1994, researchers David Horne and Christopher Cagan re-analyzed the Boston Fed’s data and found that correcting errors and adding more variables reduced the apparent racial disparity significantly. They found gross errors in the analysis, like missing credit scores, debt ratios, or employment histories. They argued that the original study overstated bias by not adequately accounting for legitimate underwriting criteria.
A subsequent review by the Federal Reserve itself found that up to 15% of the loan files had errors that were significant enough to skew results.
By 1998, no other researchers had been able to replicate the original study’s results. It was also discovered that the 1992 study involved only 131 mortgages and that they hadn’t been selected randomly. But… did any of that matter? Did the press ever correct the record? No, the political train had left the station, and there were benefits to be handed out and patronage to be collected.
The president of the Boston Fed in 1992 was Richard Syron. He knew the report was complete nonsense but made an entire career out of white guilt by alleging racism in lending. He became CEO of Freddie Mac. And he would go one to make tens of millions in bonuses while driving Freddie Mac into insolvency by 2008.
So, let me make sure you understand what really happened in the mortgage crisis. A very powerful member of the banking cartel published a fraudulent study alleging horrific racism in mortgage lending. The study was completely fraudulent and, in any case, it was based on only 131 mortgages in one city. It wasn’t difficult, using these apparently awful practices, to demonize the banks and browbeat them, directly and indirectly, with regulations to make riskier and riskier loans to minorities.
And the very same guy who was behind this big lie – Richard Syron – would go on to buy and insure hundreds of billions worth of minority mortgages, destroying one of the world’s largest financial institutions and leading to a massive government bailout.
Why? Because lending to low-income people who live in bad neighborhoods is a very, very bad idea. And no amount of “anti-racism” will change those facts, as anyone who knows these neighborhoods will tell you.
These are the facts.
Banks can’t offer mortgages to people with poor credit histories, low incomes, and on homes that can’t readily be resold. Doing so results in soaring default rates and loan-loss severity.
Everyone knew these facts. And everyone pretended that there wouldn’t be a reckoning because, in the short term, these policies enabled enormous amounts of political capital (they bought a lot of votes) and, even better, virtue signaling.
Did this do any good? No. The rate of minority homeownership is back to where it started before these “reforms.” And trillions were destroyed, losses that we all paid through vastly higher inflation.
I tell you this story to highlight something that continues in America to this day: Our government is broken.
The public is constantly manipulated by elites like Richard Syron and the media to believe things that are simply not true and cannot be made to be true. These lies will continue to cause massive losses and dislocations in our society. And they will not stop.
The list of these kinds of frauds are endless: the Vietnam War, the War On Drugs, “Two weeks to flatten the curve,” Global Warming, the 20-Year War On Terror, etc.
And, then there’s the biggest fraud of all. Social Security.
You’ve been told that Social Security is a government-backed retirement system that’s backed by a “trust fund.” None of those things are true.
Social Security is simply a tax that’s paid in part by your employer. You have no legal rights to any benefits whatsoever.
Don’t believe me? See Flemming v. Nestor, where the U.S. Supreme Court ruled that you have no property rights whatsoever through the Social Security system.
Not that these legal distinctions make any real difference because there ain’t no trust fund, either.
What the Social Security system “invests” in are government bonds – bonds that haven’t produced any real returns at all and that have been, since 2020, collapsing in value.
There is no way these “assets” (which are also government obligations) can possibly fund the existing obligations of Social Security and Medicare. The existing obligations (not the total, future obligations) are $70 trillion.
As a result, in about a decade, the current Social Security tax scheme will fail.
But that’s, of course, only if you make some very rosy assumptions about inflation and the value of those bonds. I believe the collapse of the Social Security system is already happening and that within four to six years, it will be insolvent.
But, for now, let’s pretend that nothing catastrophic happens in the next four years. And let’s assume that Musk is able to cut the budget by $500 billion.
Here’s the 2025 $7 trillion budget:
- Social Security: $1.6 trillion
- Medicare: $1.1 trillion
- Other mandatory spending (e.g., Medicaid, income security): $1.7 trillion
- Discretionary spending (defense and nondefense): $1.7 trillion
- Interest on debt: $892 billion
Here’s the 2028 estimated budget:
• Social Security and Medicare spending is growing by ~$180 billion annually
2028 Estimate $3.5 trillion.
• Other mandatory spending (Medicaid, income security) grows with population and inflation (3% to 4% a year)
2028 Estimate: $2 trillion
• Defense and discretionary spending. Elon cuts $500 billion!
2028 Estimate: $1.1 trillion
But, there’s one big unknown that no one can predict: Interest on the government’s debt.
Between now and 2028, the Fed has to refinance $21 trillion!
The Congressional Budget Office also predicts rising deficits over the next four years, with an estimated $9 trillion in new federal borrowing expected.
So with the debt coming due and the new money to borrow, the government will need to sell $30 trillion worth of U.S. Treasury bonds to investors over the next four years.

Over the last 50 years, foreign investors have financed most of our government debt. That’s made the U.S. dollar the world’s reserve currency, where it is still used to settle virtually all trade between different countries. But that is about to change.
Trump’s reciprocal tariffs will, most likely, eliminate foreign trade surpluses. That’s Trump’s stated goal. And, that’s nice, but that also cuts off our foreign lenders supply of dollars. No trade surplus = no new dollars to invest in Treasuries.
Oh, and maybe you haven’t noticed, but our foreign creditors aren’t buying Treasuries anymore. They are selling them. And they are buying gold instead.
Ever since 2010, after we bailed out Wall Street by printing trillions, central banks have been buying more and more gold. After the COVID $7 trillion printing extravaganza, the foreign central bank gold-buying spree grew to record levels. The World Gold Council (“WGC”) reports record purchases of 1,136 tonnes in 2022 and 1,037 tonnes in 2023. For 2024, full-year data shows 1,000+ tonnes again. That’s roughly $75.2 billion worth of gold, annually.
And Treasury purchases? In 2024 foreign central banks were net sellers of Treasuries in 2024 – minus $200 billion!
How in the mother-of-Jesus is the U.S. Treasury going to sell $30 trillion in Treasury bills in the next four years without any foreign buyers?
Well, what happens when demand (for borrowing) exceeds supply (bond buyers)? The interest rates (the price of borrowing) must rise.
That’s why I believe vastly higher interest rates are coming.
And it’s these higher rates that will render Musk’s efforts to cut government spending irrelevant. Musk can’t cut Social Security or Medicare. And he doesn’t control interest rates.
Even if you only assume 6.5% interest rates on this new borrowing, the government’s 2028 financing costs will be over $2 trillion.
And so by 2028 the government will still be spending $8.6 trillion a year and continuing to rack up bigger deficits. There will not be a single year where spending actually declines.
Why? Simple: Social Security is a Ponzi scheme.
And the entire Treasury market will, eventually, collapse as this reality becomes clear.
Tariffs, a trade war, and unsustainable levels of U.S. government spending and debts will destroy the entire global financial system in the next four years.
Watch.
| Wanted… Porter & Co. Seeks Time-Tested Trader Do you know anyone who is a battle-tested trader with years of street cred, deep market insight, and the scars and medals to prove it?… Porter & Co. is looking for such a person to lead our premium trading research service, to deliver high-impact ideas to our subscribers. If this isn’t you, please note that we offer a generous finder’s fee if you refer the right candidate. |
Three Things To Know Before We Go…
1. Inflation surprises to the upside… again. This morning, the Bureau of Labor Statistics reported the core personal consumption expenditures (“PCE”) price index – the Federal Reserve’s preferred measure of consumer inflation, which excludes food and energy prices – rose 0.4% in February (2.8% annualized) versus Wall Street expectations of 0.3% (2.7% annualized). With the Fed currently in “wait and see” mode, today’s higher-than-expected reading means the central bank is less inclined to drop rates next time around, barring a significant slowdown in the economy (see below).
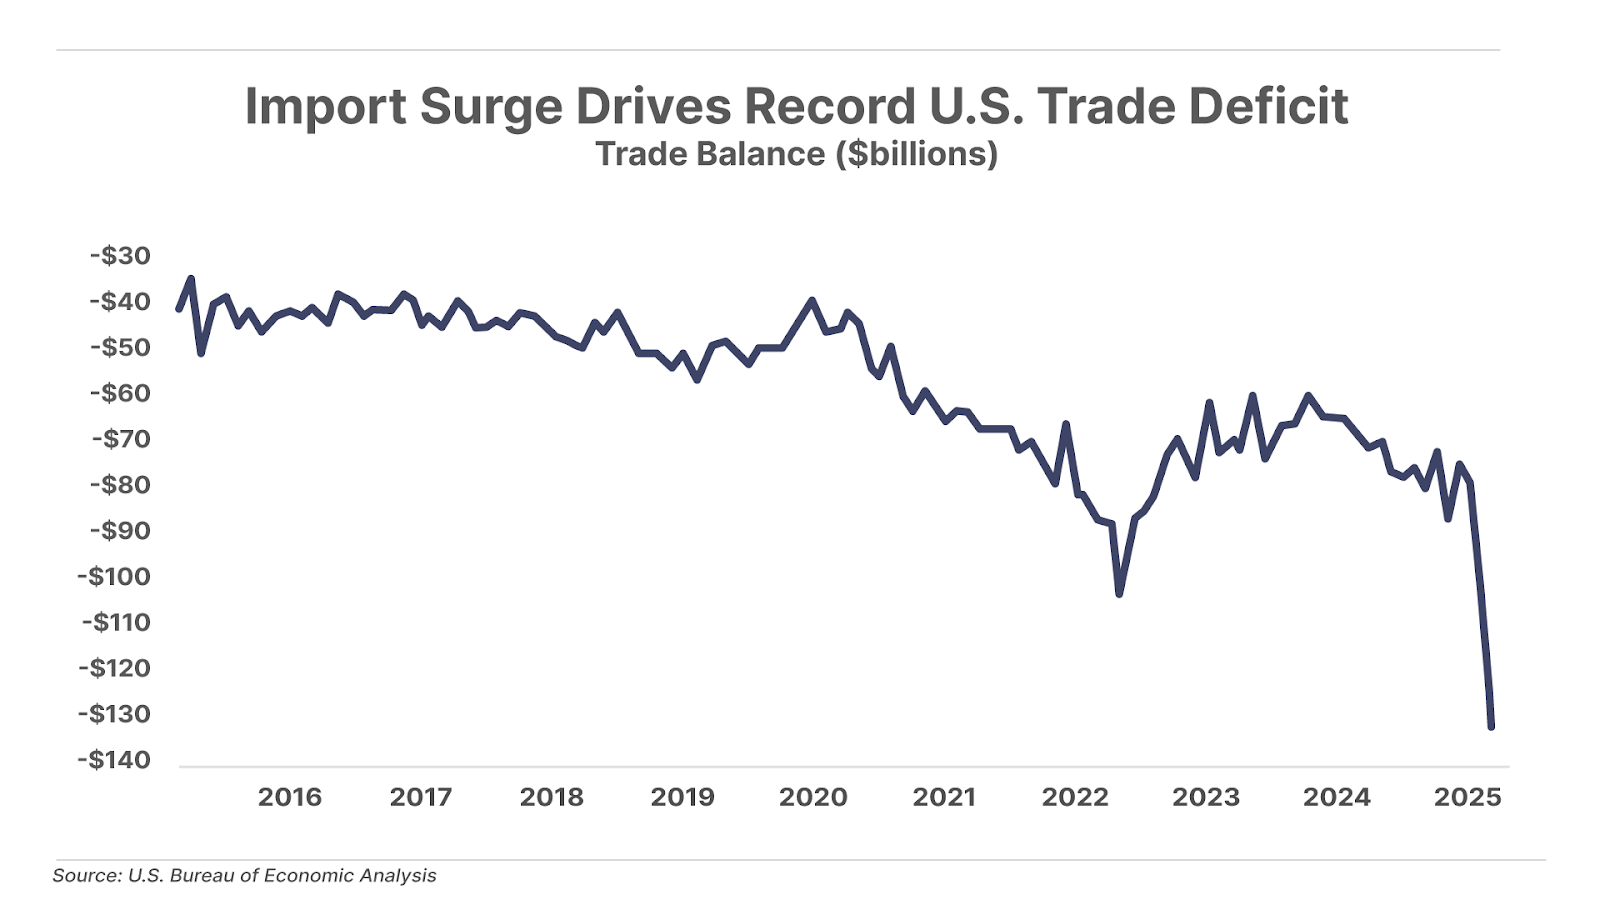
2. Import surge causes record U.S. trade deficit. The U.S. trade deficit increased to $131 billion in January, the largest on record. This is primarily the result of American companies front-loading imports (leading to lower net exports) ahead of the Trump administration’s increased tariffs. This widening U.S. trade deficit has led to a sharp drop in Q1 GDP estimates. Even if this is a one-time tariff-induced decline, it’s still a sign the U.S. economy is weakening (more below).
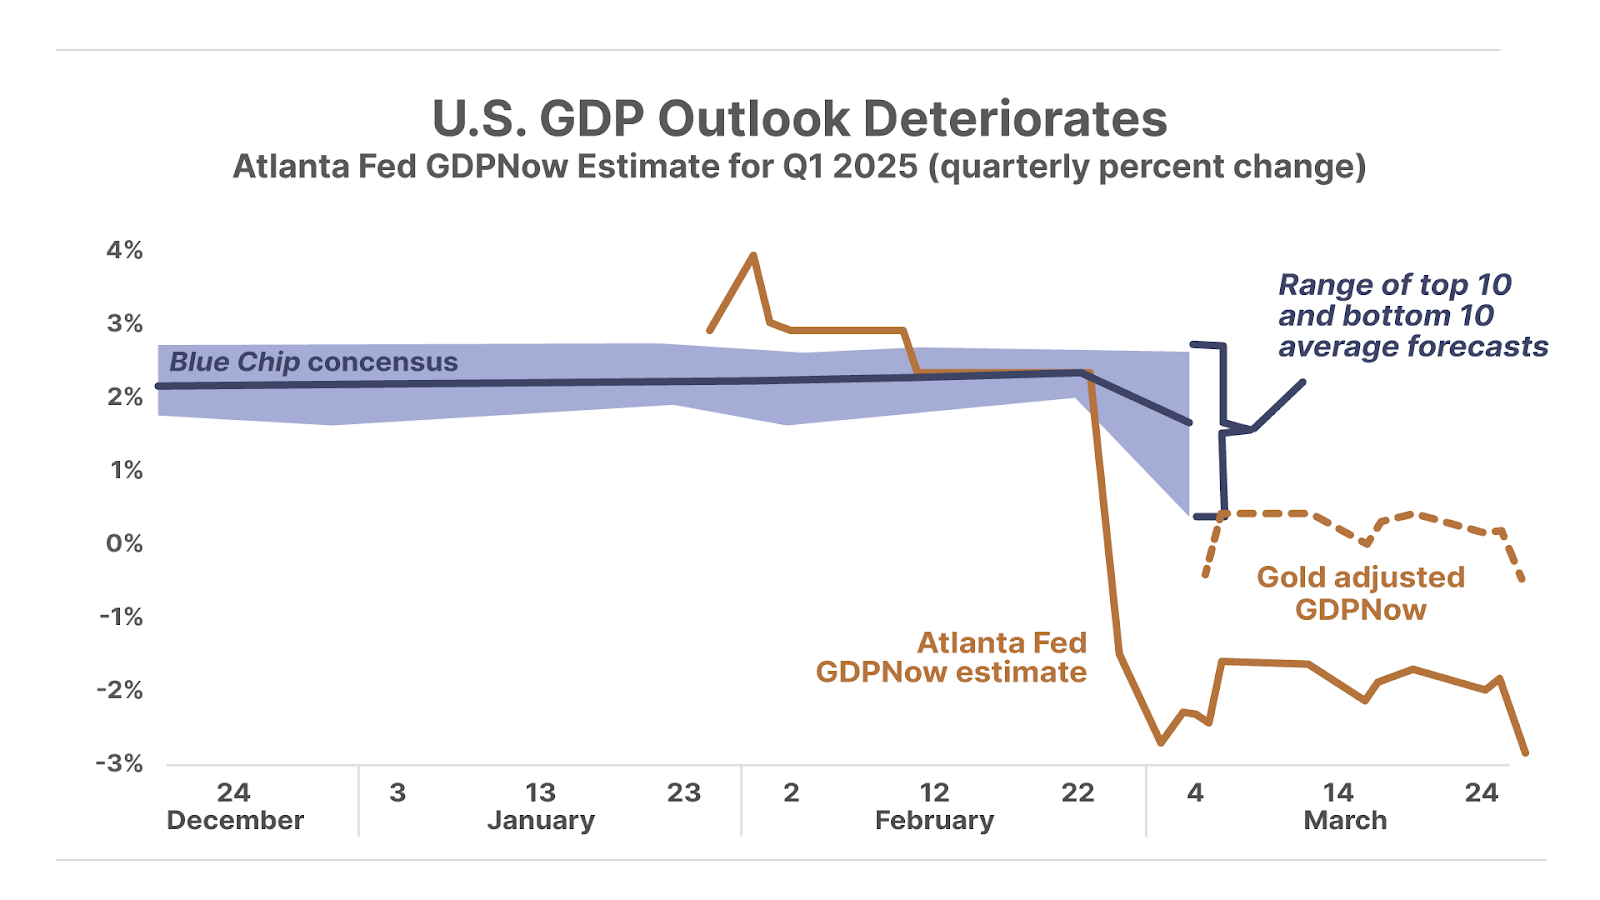
3. Growth outlook deteriorates while inflation remains stubborn. The Atlanta Fed’s GDPNow estimate has plunged 6.7 percentage points over the past three months to -2.8%, marking the first expected GDP contraction since 2022. But even after adjusting for declining net exports, which skews the GDP number downward (partly due to record gold buying), the economy is still projected to shrink by 0.5%. Meanwhile, the hotter-than-expected PCE report (see point #1 above) this morning signals that inflation is re-accelerating even as growth weakens, fueling concerns of stagflation.
And one more thing… Another Double-Bagger For Biotech Frontiers
In July, Erez Kalir added to the Biotech Frontiers portfolio TG Therapeutics (TGTX), a small drug maker that produces a treatment for multiple sclerosis, at $18.79 per share. Since then, defying what’s been a brutal market for the biotech sector, TGTX shares have soared, to recently hit $40 – for a gain of more than 100%. TG Therapeutics is the fourth Biotech Frontiers stock to double in a year… If you’re not already a subscriber to Biotech Frontiers, and would like to learn more… call Lance James, our Director of Customer Care, at 888-610-8895 or internationally at +1 443-815-4447.
Poll Results… Picking The S&P’s Forward P/E
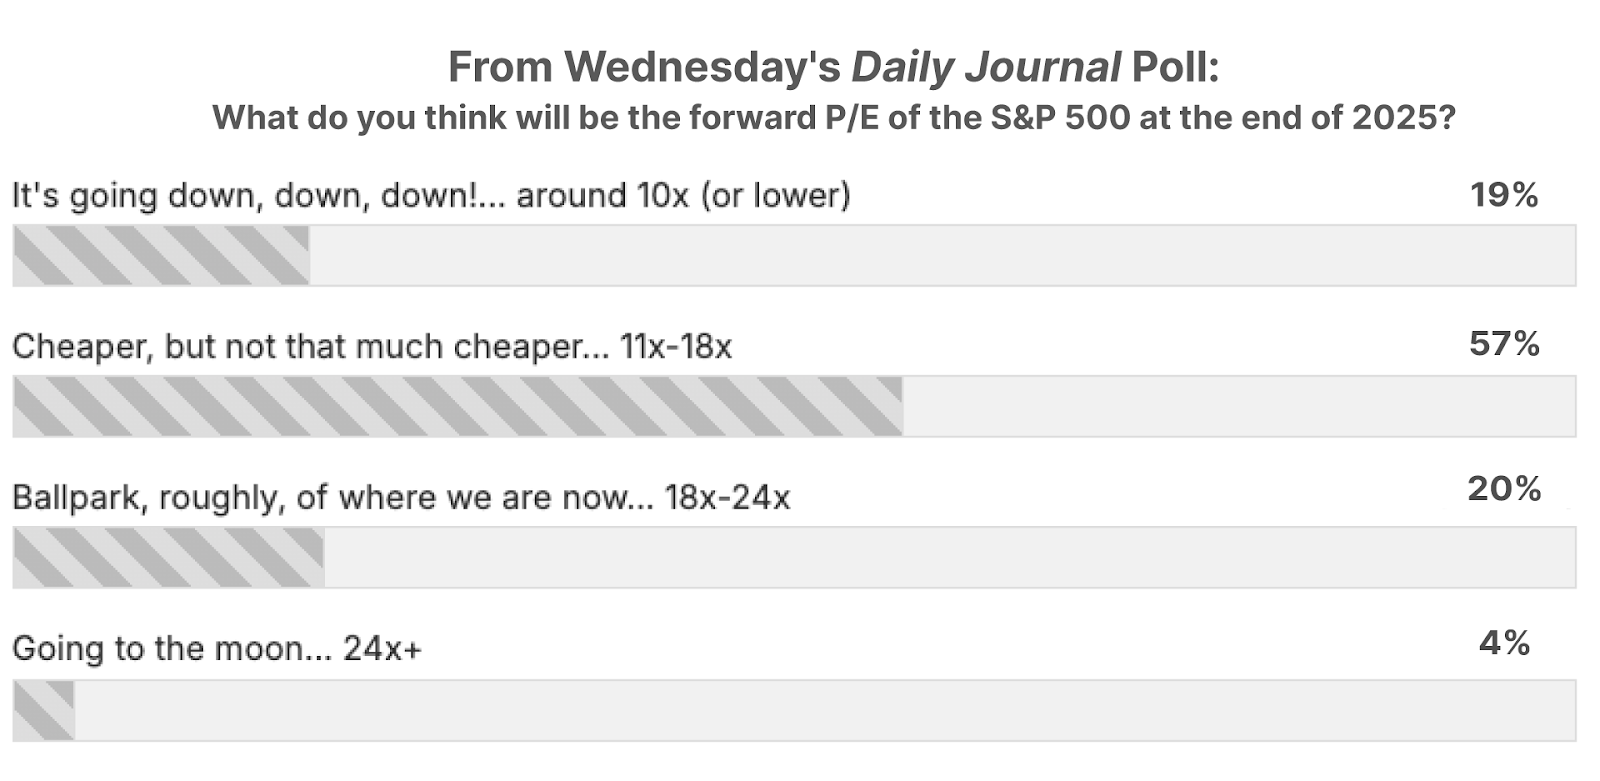
On Wednesday, ending his three-part series in the Daily Journal in which he analyzed what might happen when a weakening economy deflates sky-high stock prices, Big Secret analyst Ross Hendricks said: It’s possible that “earnings drop by more than 25%, or the valuation multiple of the market falls to around the 10x P/E multiple of the depths of the 2007-2009 bear market”… So we asked Journal readers: “What do you think will be the forward P/E of the S&P 500 at the end of 2025?”
The majority of survey takers are bearish – but only a little bearish – choosing: “Cheaper but not that much cheaper… 11x-18x,” while 20% selected “roughly where they are now,” and 19% see a big drop, opting for “It’s going down, down, down… around 10x or lower.” Just 4% of survey takers are bullish, choosing “Going to the moon, 24x.”
As always, drop us a line if you agree, disagree, or just want to comment on anything we published to… [email protected]
Good investing,
Porter Stansberry
Stevenson, MD
P.S. The ’23 Enigma’: The Most Powerful Monthly Pattern in the Market

Every 23rd day, a powerful market anomaly occurs. Now, you can learn how to exploit it for potential payouts of as much as $9,550, $12,150, and even $18,400 within a month starting with as little as $5,000.
Discover Marc Lichtenfeld’s breakthrough strategy today.

Please note: The investments in our “Porter & Co. Top Positions” should not be considered current recommendations. These positions are the best performers across our publications – and the securities listed may (or may not) be above the current buy-up-to price. To learn more, visit the current portfolio page of the relevant service, here. To gain access or to learn more about our current portfolios, call Lance James, our Director of Customer Care, at 888-610-8895 or internationally at +1 443-815-4447.