

An Extremely Effective Method For Finding Hidden Gems
In today’s Saturday Stock Screen, we are following Distressed Investing editor Marty Fridson’s proprietary method for picking stocks that outperform the market.
Each week, here at Porter & Co. we apply our brainpower to uncover the most compelling, highest-upside investment ideas. And with this complimentary issue of the Daily Journal, we draw back the curtain to show you how we do it.
An important tool in our analytical toolbox is our stock screens, in which we apply a list of criteria – relating to different financial, accounting, and performance parameters – to sift through the 3,000+ publicly traded stocks on U.S. markets. That’s how we’re able to identify the tiny fraction of the universe of U.S.-listed stocks that offer the best opportunities for making money.
We often use the results from these screens as a starting point for more in-depth analysis for possible inclusion in The Big Secret On Wall Street or any of our other portfolios.
Most people know Marty Fridson as the distressed-bond expert. He’s regarded by Investor’s Digest as “the most well-known figure in the high-yield world.”
But Marty’s investment prowess doesn’t stop at bonds. He also is a fantastic stock picker, as evidenced by the performance of the nine companies whose shares Marty has recommended in his Distressed Investing advisory, which are up 25% in a little over two years.
The screen we’re introducing this week is based on Marty’s extremely effective method for picking outperforming stocks.
In 2023, Marty published The Little Book Of Picking Top Stocks, in which he focuses on analyzing the best-performing stocks in the S&P 500 in prior years, and on the factors that led to their market-beating returns.
Today’s screen is based on the following characteristics Marty identified in The Little Book Of Picking Top Stocks as the common features among the market’s best-performing stocks:
- Bond ratings of Baa3 or lower by Moody’s and BBB- or lower by Standard & Poor’s
- Fridson-Lee statistic (defined below) of 18% or greater – meaning analysts’ estimates of the company’s earnings per share (“EPS”) vary widely
- Price volatility over the previous year of at least 1.5x that of the stock that ranked #250 that is the median of the S&P 500 by total return
- Market capitalization equivalent to 50% or less of the market capitalization of the stock that ranked #250 by total return in the previous year (some #1 stocks have been exceptions to this rule)
To further explain our methodology…
We apply Marty’s first criterion by screening for bond ratings of Baa3 or lower by Moody’s and BBB- or lower by Standard & Poor’s.
Marty explains:
Stick to below-investment-grade companies or, at most, those that are rated just one notch higher than that. If anything, consider the lack of a Moody’s rating a favorable sign. Equity analysts may not pay a lot of attention to bond ratings, but you should if you’re searching for #1.”
We apply Marty’s second criterion to our screen by only including stocks with a Fridson-Lee statistic of 18% or higher.
The Fridson-Lee statistic is calculated by subtracting the lowest EPS estimate from the highest, and then dividing by the lowest estimate. Historically, #1 stocks have shown a greater spread in EPS forecasts than their #250 counterparts, with a median difference of 33.9 percentage points.
Marty’s research revealed that #1 performers have a wide dispersion in Wall Street analysts’ EPS estimates – for instance, last year Palantir Technologies (PLTR), the top-performing S&P 500 stock, had EPS estimates ranging from $0.25 to $0.40. Wider EPS estimates suggest there’s greater uncertainty and potential upside.
Explains Marty:
In 90% of the cases we examined, the Fridson-Lee statistic just prior to takeoff was 18% or higher, with some stocks clocking in at nearly 200%. Those numbers identify the territory where you have the best chance of finding #1.”
We apply this next component to the screen by only including stocks with a beta of at least 1.5.
These top performers will also experience significant price fluctuations, with a beta greater than 1.5 (a beta of 1 equals the volatility of the overall stock market, while those above 1 are more volatile, and those below 1, less volatile) and therefore carry a greater risk of substantial losses – but are more likely to double compared to those with betas closer to 1.
Writes Marty:
Stocks that trade within a narrow range aren’t prime candidates to double in price in the space of 365 days. That would be the financial equivalent of a leopard changing its spots.”
The last characteristic of Marty’s screen includes stocks with a market capitalization equivalent to 50% of the prior’s year average-performing stock.
Smaller market-cap stocks tend to outperform larger, more established companies due to their higher-growth potential. Historically, half of the #1 performers had market caps less than one-third of this benchmark. However, some outliers like Tesla (TSLA) in 2020 showed that exceptions can occur. Therefore, this parameter should be used in conjunction with other metrics rather than as a standalone filter.
Conventional equity research, overly focused on metrics like EPS, fails to pinpoint these high flyers. The conventional wisdom can’t be applied to finding the best performers – that is, the outliers. Instead it requires a blend of quantitative and qualitative criteria that should be used in conjunction to spot them before their meteoric rise.
In addition to Marty’s criteria from The Little Book Of Picking Top Stocks, we’ve added a quality screen to include companies with a return on assets (“ROA”) or return on equity (“ROE”) greater than 15%.
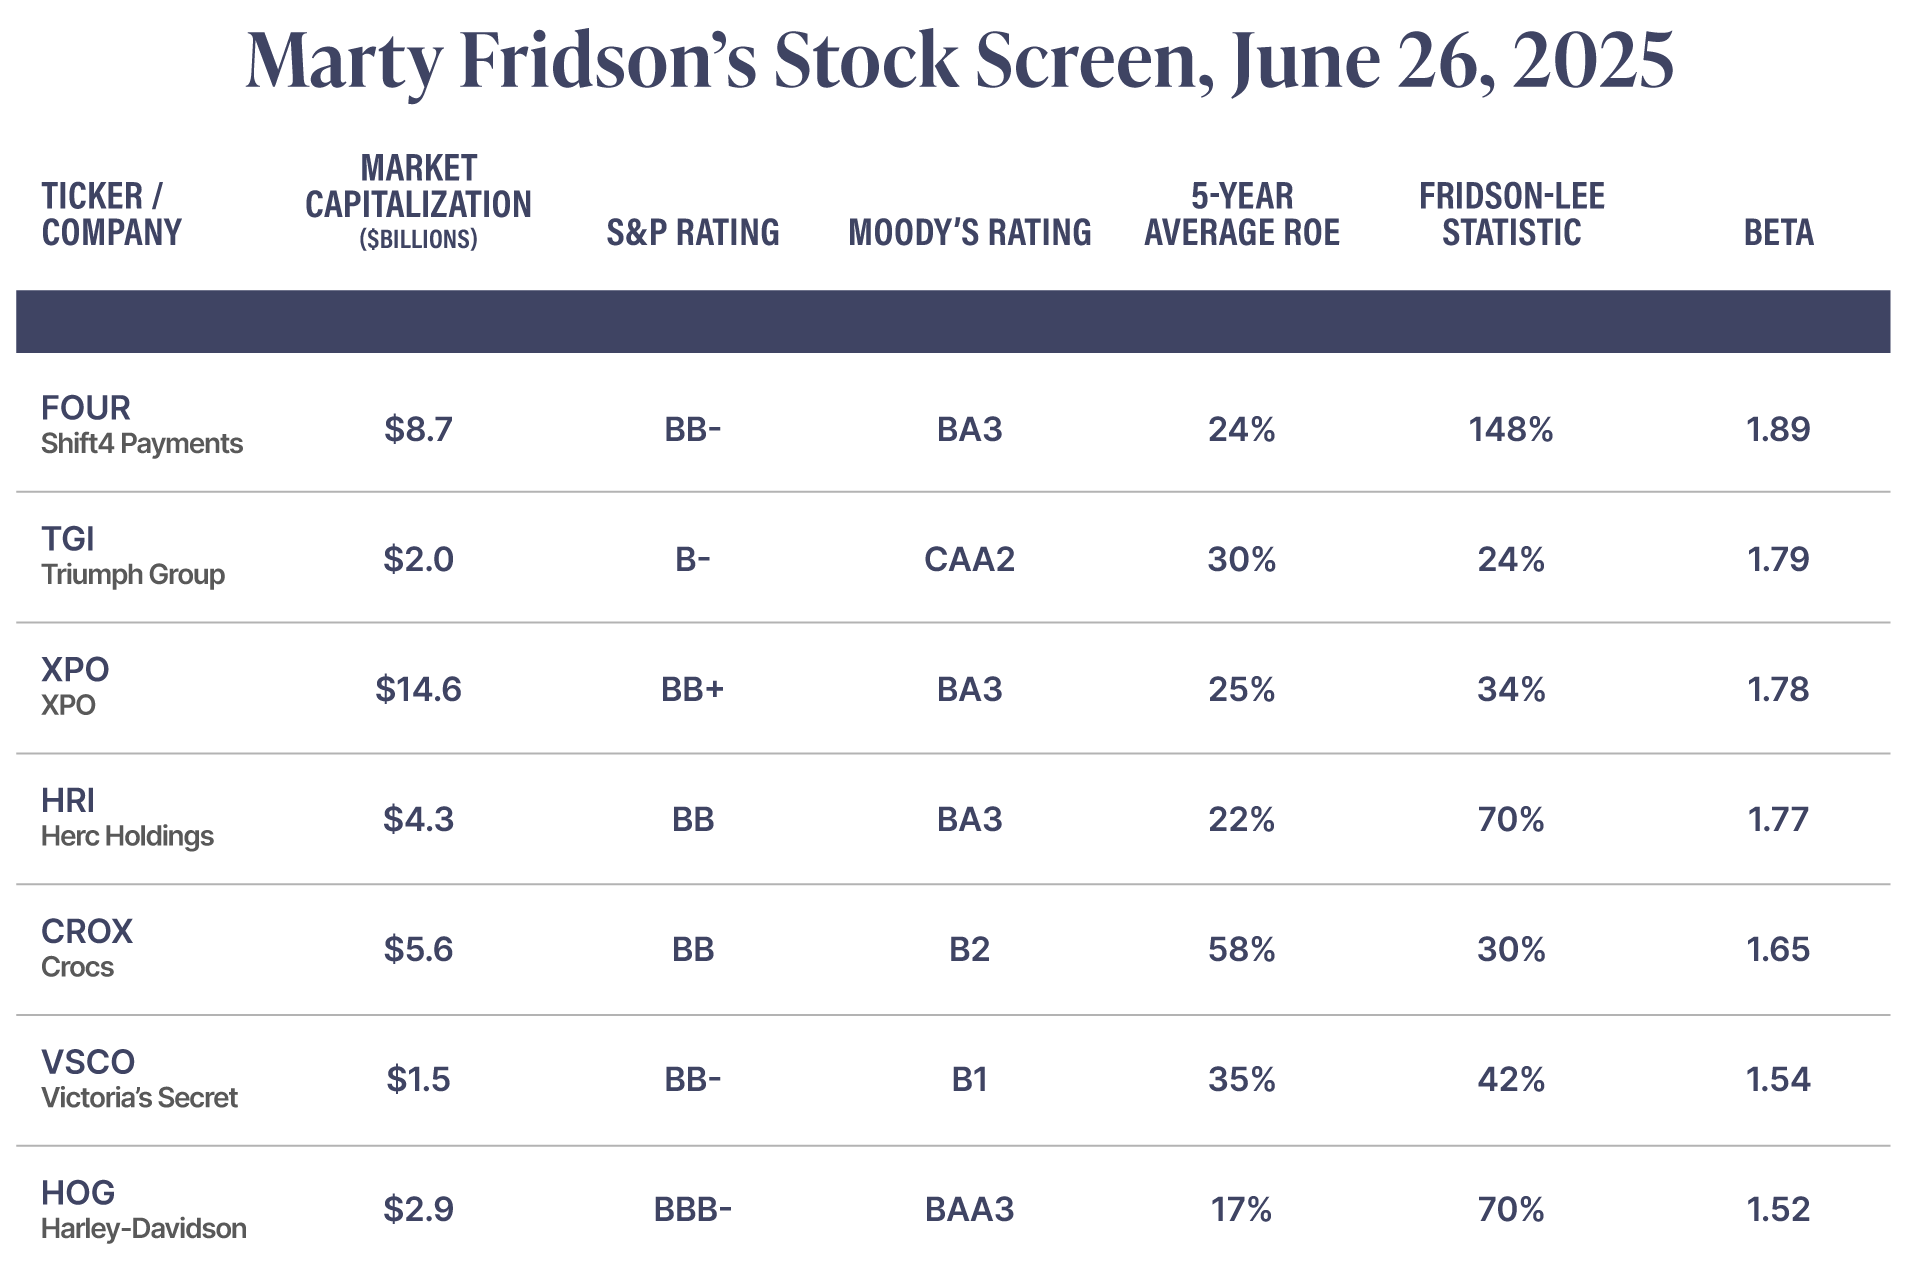
As of the close of trading on Thursday, June 26, the following seven stocks met these criteria:
Highs And Lows
Each week, we also monitor any stocks in the market making 52-week highs. We do this because any stock on its way to generating 2x, 3x, or 10x returns will spend a lot of time making new 52-week highs along the way. Thus, the 52-week-high list provides an opportunity to flag these potential high performers before they really break out, with a particular emphasis on lower-profile, less widely-followed stocks that might have otherwise gone unnoticed.
Notable stocks making new 52-week highs last week:
- AutoNation (AN)
- Amphenol (APH)
- Broadcom (AVGO)
- Credicorp (BAP)
- Citigroup (C)
- Capital One (COF)
- Coinbase (COIN)
- Coupang (CPNG)
- Corebridge Financial (CRBG)
- Crowdstrike (CRWD)
- Cisco Systems (CSCO)
- Corteva (CTVA)
- DoorDash (DASH)
- The Walt Disney Company (DIS)
- HEICO (HEI)
- JPMorgan Chase (JPM)
- Microsoft (MSFT)
- Cloudflare (NET)
- Netflix (NFLX)
- Nvidia (NVDA)
- Palantir Technologies (PLTR)
The Dark Consequences of Trump’s New Investment
The Trump administration plans to funnel billions of dollars into one specific AI company. On the surface, this investment looks like the next step in Trump’s goal to make the U.S. the AI capital of the world. But dig a little deeper, and the consequences of this investment could be much, much greater than that. This company has the power to send the current AI king on a swift and ruthless 50% crash starting as soon as August 1 – bankrupting Americans who don’t see it coming. But those who do could stand to realize historic gains over the next 12 months.

We also monitor stocks on the 52-week-low list. In many cases, the names on this list are there for good reason – the market is often correctly pricing in weak fundamentals. However, once in a while, a great business with excellent long-term prospects finds itself on this list due to a temporary setback. This can create the rare opportunity to buy top-shelf merchandise at bargain-basement prices.
Notable stocks making new 52-week lows last week:
- ConAgra Brands (CAG)
- The Clorox Company (CLX)
- The Campbell’s Company (CPB)
- Erie Indemnity (ERIE)
- General Mills (GM)
- PepsiCo (PEP)
- Boston Beer (SAM)
- Sarepta Therapeutics (SRPT)
FOR PARTNERS ONLY
Disrupting Healthcare With A Patient-First Model
The company we’re highlighting for Partner Pass members is a fast-growing telehealth innovator that’s disrupting the $4 trillion U.S. healthcare industry. Its modern, digital-first platform is eliminating stigmas around care, increasing accessibility, and becoming the front door to a better healthcare experience.
Here’s the opportunity: the U.S. healthcare system is one of the few industries where nearly every player – from insurers to providers – profits regardless of whether the patient receives quality care. Long wait times, opaque pricing, and layers of middlemen have become the norm. The company we are flagging today is flipping this flawed model on its head. It only retains a customer when the customer is satisfied. By prioritizing outcomes, experience, and ease of access, it’s reshaping healthcare customer centric approach – delivering affordable, individualized care across mental health, sexual wellness, dermatology, primary care, and more.
But here’s what caught our attention – the termination of a recent partnership triggered a 35% drop in the stock price, making shares more reasonably priced. (To become a Partner Pass member, contact Lance James, our Director of Customer Care, at 888-610-8895, internationally at +1 443-815-4447, or via email at [email protected].)
This content is only available for paid members.
If you are interested in joining Porter & Co. either click the button below now or call our Customer Care team at 888-610-8895.