Editor’s Note: On Tuesdays we turn the spotlight outside of Porter & Co. to bring you exclusive access to the research, the thinking, and the investment ideas of the analysts who Porter follows.
(If you missed our announcement explaining this new membership benefit, The Porter & Co. Spotlight, you can read it here.)
Each month we’ll focus on an analyst who isn’t part of the Porter & Co. family, whose work Porter thinks you need to be aware of – and that he believes could make a big difference to your finances.
These are analysts Porter has known and followed for years, if not decades, whose ideas and insights have withstood the test of time, and who have helped Porter make better, more profitable investments.
(Please note: the publishing schedule at Porter & Co. is changing and you’ll now receive Spotlights on Tuesday instead of Monday.)
My friend of more than 20 years, Tom Dyson, is not only the greatest investor you’ve never heard of, he’s also a savant at the single greatest investment challenge: your emotions.
There aren’t many real geniuses in the investment business.
That’s because investing isn’t all that hard, intellectually.
Where it’s difficult is the emotional side. Can you be patient enough? Can you be humble enough to cut your losses when it’s clear that you’re wrong? Can you remain disciplined to a winning strategy when there’s a drawdown?
Most people can’t do any of these things.
Tom, more than any other analyst, has always understood this challenge and has faced it head on.
Yes, I could tell you dozens of outrageous Tom investment stories, like when he piled into gold in the early 2000s or when he bought Bitcoin at $1 in 2013.
I could tell you about his long-term gains in Microsoft, which he recommended in 2006. Or about the incredible gains he’s made for his readers recently in shipping stocks (yes, shipping stocks).
But, quite honestly, the reason you should read Tom Dyson each week isn’t merely because he is a genius at investing and will bring you outrageously good investment ideas.
You should read him each week because he understands the emotional challenges of putting capital at risk and, unlike anyone else in this business, he can guide you through those challenges.
Tom won’t just give you great investment ideas: he will sit in the fox hole with you and fight.
Read him and you’ll see immediately what I mean.
Start here: read his latest issue and recommendation below. Until now, this was only seen by the private members of Bonner Private Research, the phenomenal newsletter written by Tom Dyson, Dan Denning, and Bill Bonner.
Then, if you want more (which you almost certainly will), check out the special offer they’ve put together exclusively for Porter & Co. readers by clicking here.
The Sounion, the fully-loaded Suezmax oil tanker we wrote about last week, is still on fire, adrift in the Red Sea and likely to sink soon.
Two days after their initial attack with missiles, the Houthis returned to the vessel and set off explosives on the ship’s deck, igniting several fires. They intended to sink it.
A tweet from the European Union’s naval force earlier today said the “aft section of the vessel has sunk and the forward section is still ablaze.”
Someone tried to send tugs to salvage the wreck but the Houtis threatened to attack them.
An article in TradeWinds, a shipping industry publication, says the oil spill from this ship could land insurers with a $600m bill.
What’s the point of sinking it? Wouldn’t it make more sense to tow it into port and take the oil, which is worth around $70m at current market prices? More below…
***
Let’s begin this month’s letter with the conclusion: we’re making the first change to our asset allocation model in two years to reflect the new weak dollar trend, which we may now be entering.
We want to hold more gold and other precious metals. And we want to hold less cash. Today I’m moving our asset allocation to 40% physical precious metals (from 35%), 35% cash (from 40%) and 25% stocks.

The Big Picture is simple. We’ve just lived through a great credit expansion – the greatest of all time. I’ve spent the last twenty years trying to understand this great credit expansion. It’s deep and complicated and like all great inflations, it relies on a self-reinforcing cycle of rising asset prices, creating a rising perception of wealth, more consumption and production, recycling profits and surpluses back into assets, driving asset prices even higher, creating even more wealth on paper. Wash, rinse, repeat.
The relationship between China and the US was central to this reinforcing cycle. China became the world’s factory. The US provided the ever-rising asset values. The US purchased from China. China invested its surplus in US markets. Everyone’s paper wealth, consumption and production increased.
Now the relationship between China and the US is falling apart. China’s cheap exports steal entire industries… and jobs. The global auto industry will be China’s next victim. China is now producing millions of cheap cars, both EVs and gas models, and exporting them all over the world.
Last week for example, Canada announced a 100% tariff on Chinese cars. Essentially, Canada said to China “we don’t want your cars.” The USA has already imposed the same tariff. The EU imposed tariffs earlier this month.
Why has Canada suddenly taken a stand against Chinese imports? The Canadian auto manufacturing industry is one of Canada’s most important manufacturing sectors, directly employing 120,000 people.
Please read this article by Michael Dunne, author of the Dunne Insights newsletter, for a good summary of China’s attack on global car markets…

Where the rubber meets the road
If you’re new to Bonner Private Research, I’m Tom Dyson, Bonner Private Research’s Investment Director.
As Investment Director, it’s my job to build the actionable investment strategy that complements the writings and thoughts of Dan Denning and Bill Bonner. I’m where the rubber meets the road, as they say…
My proposition is simple. The self-reinforcing cycle has gone as far as it can and now, as China and the West break up, the Primary Trend – or the self-reinforcing cycle of globalization – is reversing. So next we get deflation… especially in terms of gold.
When the timing is right, we try to make low risk tactical trades to try to capture a little income. The recent troubles in the Red Sea have given us such an opportunity. Last week we added a new stock, Zim Integrated Shipping [ZIM]. See below for the details.
Am I being overly cautious? Maybe. But I think a major deflation might be coming… a debt crisis. And I want to be ready for it. If there were one chart to express the bearish view, it would have to be this one. The blue line is household net worth. The red line is GDP.

Source: US Federal Reserve
They should stick to each other, as they used to. They started diverging when then-Federal Reserve Chairman Alan Greenspan began blowing bubbles. In short, Greenspan, Ben Bernanke, Janet Yellen, and Jerome Powell went on to cause an epic 30-year wealth inflation.
Whenever they stop inflating, the blue line tries to close the gap. That’s “inflate or die” in one picture. Bull market returns are one hell of a drug… and now we’re about to get one hell of a hangover…
I have always thought the currency market would be the main release valve for the losses. I call it a ‘synchronized global currency devaluation’.
I wasn’t sure if there’d be a crisis of some kind first, to trigger the devaluation. It seemed likely, especially when two years ago, the Fed set interest rates over 5% and began reducing its balance sheet.
But since gold broke decisively through $2,000 in February and now the Fed is preparing to cut rates again and no serious crisis – we’re holding too much cash. We need a larger gold position and a smaller cash position.
We’ve built a fortress portfolio. Our preference is to hold a bunch of precious metals, a bunch of cash and a bunch of cheap value stocks that ideally generate 10-12% a year in income and capital gain.
The precious metals protect us from currency devaluation. They’re doing a great job so far. The cash protects us from falling prices and pays a little interest. It’s time will come. And the value stocks keep us exposed to the ongoing economic boom. In short, we’re hedged against whatever the market can throw at us, but we’re beating inflation.
Avoid ‘the Big Loss’
So I’d rather be too cautious than not cautious enough. Remember, our main goal (for the moment) at Bonner Private Research is to help our clients avoid ‘the big loss.’ A 20% bear market is one thing. A ‘draw down’ of 50% to 70% in gold terms is a whole different animal. It can take years to recover from that kind of loss to your retirement.
That’s why, in this game, the first order is survival. And then the second order is patience. Big “all-in” opportunities come around every five years or so. Like gold in 2002. Or stocks in 2009. Or bitcoin in 2012. Or energy in 2020.
The next big “global event” – if I’m right – will be a deflation. At which point we’ll buy raw materials, shipping, precious metals and other assets that will do well as the Fed re-inflates.
If I’m wrong, we lose a little. But if I’m right, we make a life changing profit…
Last week, I added a new stock to our Official List. The company is Zim Integrated Shipping Services [ZIM].
Zim is an ocean liner. It moves containers across the oceans on boxships. The container shipping industry boomed during covid, then it used the bonanza to order hundreds of brand new ships, destroying freight rates and ensuring a glut in supply for years to come. (The industry is still ordering new ships. More new orders were announced this month.) Zim’s stock price went from $4 to $42 and back to $6 all within three years (adjusted for dividends).
I thought that was the end of Zim’s story and my interest in the container shipping industry until the Houthis began attacking ships in the Red Sea. The high risk meant container ships could no longer pass through the Suez Canal and would have to go around the southern tip of Africa to go between Asia and Europe. Freight rates soared and Zim’s stock price bottomed.
Here’s the situation now:
Zim has a market cap of $2.3bn. Zim shows long term debt of $4.1bn, cash of $1.6bn and long term lease obligations of $4bn. If you strip out the long term lease obligations (not really debt) from its long term debt, Zim has a net cash position of $1.5bn. So cash represents 65% of the value in Zim’s stock. We’re getting the operating business for about $800m.
Zim released its latest earnings results, for Q2, nine days ago. They showed Zim generated over $1bn in free cash flow in the first half of the year… about 44% of its market cap. Then Zim told investors that it would make twice as much profit in 2024 than it had previously anticipated, implying a much stronger second half of the year.
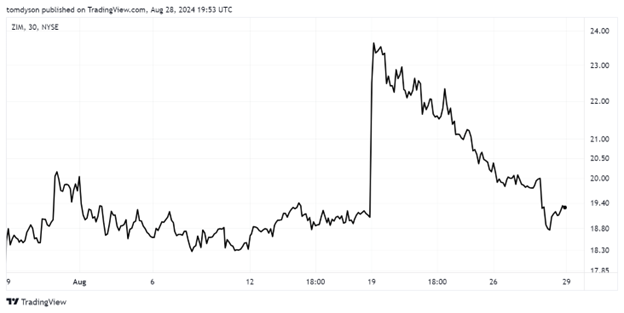
How much free cash flow will Zim produce in the second half of the year? It’s impossible to say, but the stock instantly jumped 24% when Zim released Q2 results nine days ago.
Since then it has given back all the gains. Zim currently trades for $19.23… where it was trading just before releasing its Q2 results.

Zim has declared $1.16 in dividends on the profits it has generated so far this year. But given Zim’s new guidance, and its policy of paying out 30% of its net income as dividends, if the freight market stays anywhere near current levels through the rest of the year, Zim will pay more than $3.50 in dividends over the next two quarters… possibly a lot more. That’s a 36% annual dividend yield at least!
Much can go wrong with this idea between now and the rest of the year, especially if the Red Sea opens up to shipping again. But given Zim’s massive cash position, we have a big margin of safety here. The recent pullback in ZIM’s stock is giving us an excellent entry point to take a position.
QUESTION: All of BPR predictions of inflation and gold, etc are certainly valid, but what timeline? Is the BIG LOSS soon or in another 20 years? US GOV seems to be able to kick the can down a very long road?
MY RESPONSE:
I’ve pondered this question over and over again. They were predicting the debt would cause a crisis fifty years ago. And here we are. But firstly, interest rates went to zero… and couldn’t go any further. And second, the vendor-financing arrangement with China went about as far as it could go. And third, inflation finally showed up, which I think has changed people’s behavior. But most importantly, the US government was always solvent enough to be able to defend the currency. For the first time in my lifetime, it’s not. They bailed out the tech bubble, then they bailed out the housing bubble, then they bailed out the Covid crash… but who will bail out the Treasury now it’s so heavily in debt?
Dow/Gold Ratio
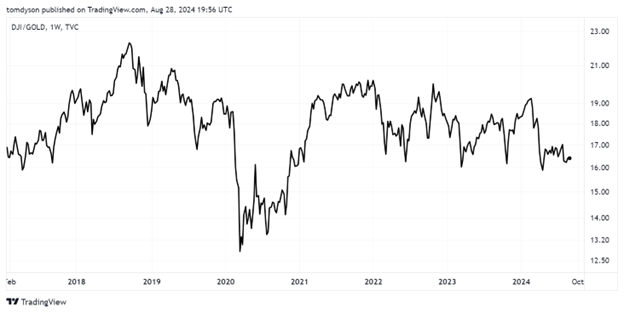
The Dow/Gold ratio is our indicator of the Primary Trend… the progress the market is making deflating asset prices in terms of gold. The Dow is an index of thirty great American companies, the type of companies the biggest fund managers in the world like to own. Apple, Amazon, Boeing, Disney, JP Morgan and American Express are all Dow components.
The gold price shows us the long term purchasing power of the dollar. Combine them together and the ratio reveals the Primary Trend. You see the real, inflation-adjusted performance of the big US stocks, which is a pretty good indicator of asset prices in general.
Here’s the 8-year chart. The trend has been drifting lower for six years. We’re in a very tricky, policy-driven market and I encourage readers to stand aside and watch traders duke it out from behind the ropes. For new readers, by ‘policy’ I mean non-stop government intervention to prevent the bubble from deflating.
Our strategy is to stay out of general stock investments – represented by the Dow – while the Primary Trend is negative. We think the Dow Jones Industrials, the S&P 500, and the Nasdaq will continue to fall in terms of gold. When the Dow/Gold ratio goes below 5, we will reverse our position, sell our gold and buy high quality stock investments with the proceeds.

Doom Index

Source: Zerohedge
Our Doom 2.0 Index measures the flow of energy through the real economy as it is used by businesses, transportation companies and consumers. We monitor and compose the Doom Index 2.0 using eight real world, hard economic variables. The eight components are: cardboard box prices, the Baker Hughes Rig Count, the cost of fast food, office vacancies, gas prices, the Cass Freight Index, RV Sales, Tanker Rates.
We present the Doom Index as a score 0-24 (12 is neutral, below 12 signifies economic contraction and above 12 signifies economic expansion) to give us a true picture of the world’s economic health in real time.
The index remained at a ‘9’ rating this month. This rating keeps us in the ‘moderate economic contraction’ range. The updated Doom Index 2.0 readings are based on July’s data.
Key highlights:
- The Big Mac/Minimum Wage ratio remains at 78.5% – no changes to either metric. For context, the ratio was just 66.5% at the start of 2020, 59.2% at the start of 2015, and 47.3% at the start of 2010. And if we want to go back to the turn of the century – January 2000 – the ratio was 43.5%.
- The Cardboard Box Price Index continued to trend lower. It fell another 40 basis points this month. This suggests that demand for consumer goods remains sluggish.
- Gas prices moved slightly higher. The average price at the pump in the US was $3.60 in July – up from $3.58 in June.
- The Cass Freight Index rose by 3% this month. This is the first uptick we’ve seen since February. That said, this move higher only puts the index back to where it was in March… so it could simply be seasonal strength.
- The oil rig count increased this month for the first time since February as well. It shows that 8 rigs went online in July. That brings the current rig count to 589. That’s up from last month… but this is still the lowest rig count we’ve seen since December 2021.
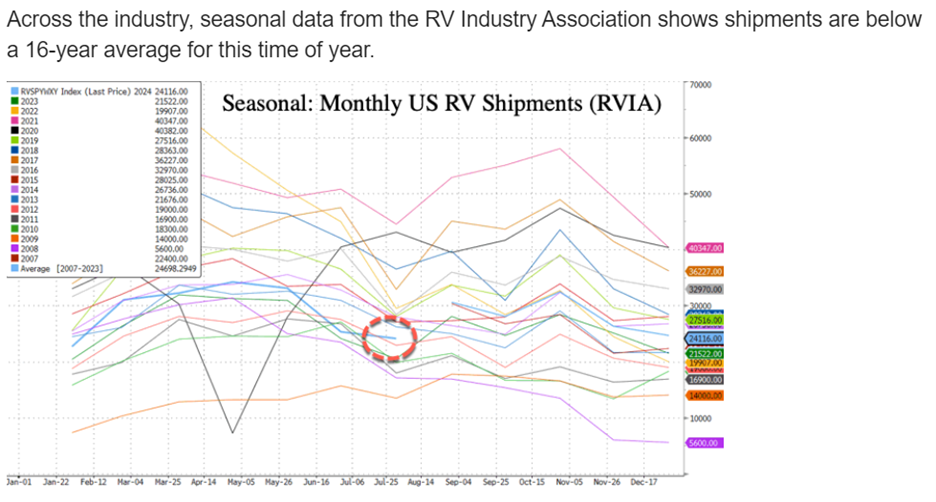
- RV sales dropped precipitously this past month. July sales came in nearly 24% lower than June sales. This is the biggest drop we’ve seen all year.
- Office vacancies remain stuck in the low 18 percent range – no news there.
- Tanker rates held firm at $38,500 this month. The going rate has remained in this tight range between $38,000 and $39,000 since last September.
If you’d like more from Tom Dyson, including his full portfolio where the average return is already 30%+, check out this special offer he’s put together exclusively for Porter & Co.
With a recession looming, there’s arguably no better guide for getting you through the storm than Tom – his portfolio construction and investing approach will not only safeguard your wealth but grow it too.
Do not make the mistake of not following Tom. I know I won’t. Because after 20 years in the trenches with him, I can tell you he’s a true investing genius. Get more from Tom here.