
Reviewing Our Performance To Date
Key Takeaways From Our First Three Years Of Recommendations
| This is Porter & Co.’s The Big Secret On Wall Street, our flagship publication that we publish every Thursday at 4 pm ET. Once a month, we provide to our paid-up subscribers a full report on a stock recommendation, and also a monthly extensive review of the current portfolio… You can go here to see the full portfolio of The Big Secret. |
Here at Porter & Co., we recently celebrated our three-year anniversary.
In honor of this milestone, we’re sharing our first official Big Secret On Wall Street “report card” this week.
Longtime readers may recall that I (Porter) started this unusual tradition nearly two decades ago at my previous firm, Stansberry Research.
Each year, I would “pull back the curtain” and show readers exactly how our various advisories had performed in both absolute terms and versus the broad market. Good, bad, or (sometimes) ugly… we would show it all.
This kind of radical transparency was unheard of in the investment-newsletter business at the time (and frankly, still is today). So… why on Earth did I do this? Why would I willingly – and eagerly – highlight our biggest mistakes, when none of my competitors in the business did the same?
The answer was simple: I was genuinely interested in helping our subscribers improve their investing results. And the only way to get better at investing is by studying your own results and learning what you’re doing right and what you’re doing wrong.
In other words, our report cards were simply a natural extension of my longtime guiding philosophy: To give my customers the information I would want if our roles were reversed.
So at the end of every year, my team and I would conduct a detailed audit of every publication, analyst, and strategy we published. We did our best to pick sensible time periods based on the market cycles, ranging from a few years to five years or more. We’d release the summary data, showing average returns, holding periods, and win rates – so that our subscribers would know exactly how we’d done. And I would then assign an A-F letter grade, based on how well I thought the publication had performed.
At Porter & Co., we haven’t been publishing long enough to have experienced a full market cycle. However, as we mentioned in our portfolio update last week, it has now been just over three years since we launched The Big Secret On Wall Street in June 2022.
Given our focus on long-term investments, this three-year mark has provided an adequate minimum track record to officially review our results to date.
So today, I’m thrilled to bring this tradition to Porter & Co with our first Big Secret report card.
Before we dig into the numbers, a quick explanation is in order.
You see, accurately measuring our performance is more difficult than you might realize. That’s because you can’t directly compare a newsletter’s track record with an index like the S&P 500. Our portfolio was formed by a series of recommendations that accumulated over the past three years. The S&P 500 index, on the other hand, is fully “invested” at all times.
To overcome this limitation, we compare our average and annualized results with a “weighted” return of the S&P 500. We look at how each individual recommendation has performed compared to buying the S&P 500 at the time of the recommendation.
In other words, for each recommendation, we compared how you would’ve done if you bought the recommendation, or simply bought the S&P 500 instead. This is the best “apples to apples” comparison we can make.
So… How Did We Do?
Looking at our results this way, across all of our recommendations, the average total return for The Big Secret On Wall Street was 23.5%, with an average holding period of just under a year and a half (523 days), for an average annualized gain of 15.1%. The average return if you’d bought the S&P 500 over the same period was 26.8%, with an 18% annualized gain.
So, on average, you would have made about 14% more money in stocks over the last three years buying the S&P 500 as you would have made buying all of our recommendations in The Big Secret On Wall Street.
While I would have preferred to have beaten the market over our first three years – and you’re welcome to criticize us for failing to do so – I’m generally pleased with our performance so far. I would grade it a B+. Here’s why…
- Even including the sharp but brief “Liberation Day” selloff this spring (when President Trump first rolled out his tariff plans on April 2), the market has been on an historic run over the past three years. Beating the market during this period hasn’t been easy, especially if, like us, you weren’t willing to “pay up” for many of the expensive tech stocks that have led the S&P 500 higher.
- We’ve done a good job picking winners. Our win rate to date is 62%, meaning almost two out of three of our recommendations have generated positive returns.
- Most important, our highest-conviction recommendations have greatly outperformed the market.
For example, our lowest-risk opportunities (those with a risk rating of 1) nearly doubled the return of the S&P 500. They returned 83% on average (29.3% annualized), compared to their matching S&P returns of 44.6% (17% annualized).
Our #2 and #3 ranked opportunities returned 30.7% (18% annualized) and 28.5% (15.5% annualized) respectively, and only slightly underperformed the market.
But our #4 and #5 ranked opportunities did relatively poorly, with our lowest-rated recommendations actually producing negative average returns.
We found a similar trend when examining our recommendations across different portfolio categories.
For example, we performed best in Property & Casualty Insurance, with an average total return of 66.2% versus 27.2% in the S&P 500. This isn’t a big surprise, as this industry has been a primary focus of mine for years.
Our Battleship Stocks did very well, with average total returns of 52% versus 49.4% for the market. Again, this isn’t a surprise…I’ve spent the last 20 years studying winning “power law” businesses – enduring high-quality companies that steadily perform through the ups and downs of the overall market.
We also did well with our Energy & Commodities recommendations, with average total returns of 32% versus 25.6% for the S&P 500. And I’m pleased with our Parallel Processing Revolution recommendations so far – despite getting stopped out of these stocks relatively quickly last fall – with an average total return of 10.1% (86.9% annualized) versus 4.81% for the market.
We have admittedly underperformed the market with our Forever Stocks, with an average total return of 16.7% versus 25.6% for the S&P 500. However, digging deeper, we can see this relative underperformance is due almost entirely to just four positions – Danaher (DHR), Diageo (DEO), Nike (NKE), and The Hershey Company (HSY).
These stocks have recently suffered some of their sharpest declines in history. This has caused a short-term drag on the overall category, but it also represents a significant opportunity – we remain confident that these world-class companies will recover from their recent setbacks, and are likely to outperform the market over the long-term.
In the meantime, if we exclude these stocks, our eight remaining Forever Stocks would’ve trounced the market with a 35.4% average total return.
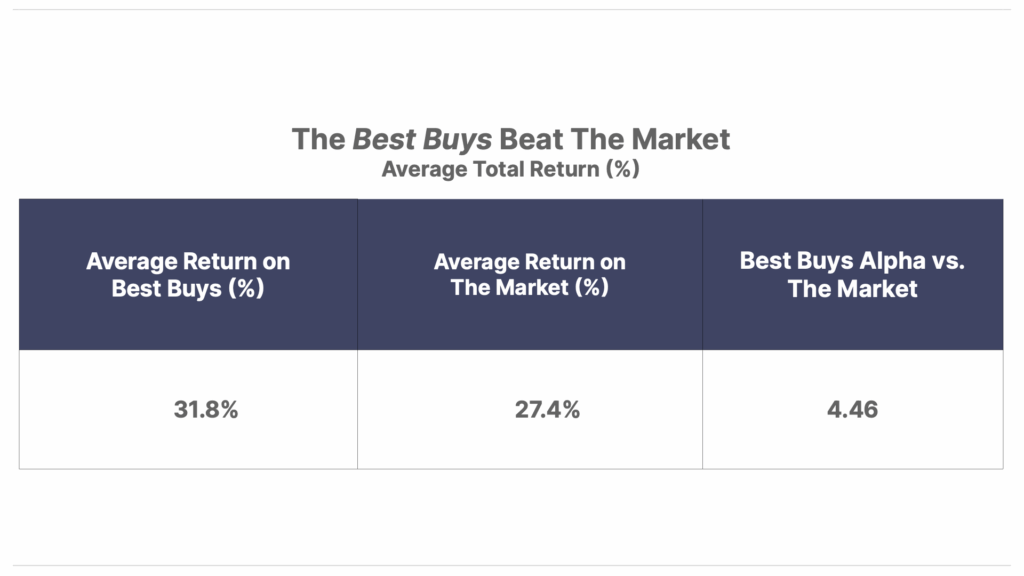
Finally, though they’re not an official segment of our portfolio, it’s also worth noting that our Top 3 Best Buys – our highest-conviction current recommendations that we publish at the bottom of every Big Secret issue – have produced a total average return of nearly 32%, easily beating the market.
Unfortunately, other segments of our portfolio haven’t fared as well.
We aren’t aiming to beat the market with our High Yield segment. We’re just trying to generate significant income in relatively safe vehicles. From that perspective, our 4.7% average total return compares quite favorably to the negative 10.7% return that subscribers would’ve earned in U.S. Treasury bonds – as tracked by the iShares 20+ Year Treasury Bond ETF (TLT) – instead. But including these stocks in our overall results is still a big drag on performance.
Some of the worst performance came from our Exponential Growth segment, where the average results have been negative. On average we lost 13.4% on these higher-risk stocks versus a 16.7% positive return for the S&P.
We also lost money on one of our two short positions, for an average return of negative 22% versus negative 0.29% for the S&P 500.
What Did We Learn?
I’m generally pleased with how we’ve done so far. But I also see plenty of room for improvement.
In particular, I think our results confirm that we’re pretty darn good investment analysts… when we stick to what we know best.
But when we’ve strayed from that focus and taken on bigger risks, our results have been relatively poor.
So… we’re going to stop doing that!
Going forward, we are going to stick to what we know best: we’re going to keep our portfolio stacked with best-in-class businesses that are also likely to be power-law winners, while avoiding the riskier opportunities that have dragged down our performance to date. As we explained in last week’s update, we’re primarily looking for companies with the following characteristics:
- High and consistent return on equity (“ROE”) in excess of 20%
- Capital efficiency, indicated by free cash flow (“FCF”) margins exceeding 10%
- Evidence of excellent capital allocation (i.e., management teams that favor shareholder returns over capex and acquisitions)
- Revenue growth of at least 5% per year over the long run (three years or longer)
As we reviewed our performance, it was clear that sticking with these simple criteria has rarely failed us. However, when we’ve strayed from these guidelines, it has almost always led to poor returns.
As part of this change, we recommended selling or closing out positions on 10 companies in our portfolio that didn’t meet those criteria, or where the fundamental thesis hadn’t worked out as expected.
Finally, we also introduced a new risk-weighting approach to more accurately track the “real world” performance of our recommendations. (if you missed last week’s update, you can catch up on the details here.)
We believe these changes will dramatically improve the results Big Secret On Wall Street subscribers can expect to achieve in the future.
New to The Big Secret Portfolio? Start With Our Top 3 Best Buys Today
Our goal at Porter & Co. is to bring you world-class investment research, focused on “inevitable” businesses that you can buy and hold forever. This is the surest and safest path to building permanent wealth.
While we don’t believe in timing the market, we do keep a constant eye out for bargains. In each edition of The Big Secret, we highlight three current portfolio picks that are at an attractive buy point. We suggest you focus on these.
Since we began compiling and tracking the performance of the Best Buys in February 2023, the companies on the list have generated a 31.8% return, while the overall market, measured with the S&P 500, has produced a 27.4% return.
This content is only available for paid members.
If you are interested in joining Porter & Co. either click the button below now or call our Customer Care team at 888-610-8895.